| cover-image | https://raw.githubusercontent.com/eurodatacube/eodash/c59adc7d580c6ced1f85a44c5bdd18bf94b3c9ee/app/public/data/story-images/7-greenhouse-gases-from-combustion.jpg |
|---|---|
| date | 2025-01-01 |
| theme | atmosphere |
| tags | climate,pollution |
| official | true |
| collections | N9_OMI_trno2-COG, N1_NO2_monthly, N10_OMSO2PCA-COG |
This trilateral story, produced in collaboration by the European Space Agency (ESA), the National Aeronautics and Space Administration (NASA), and the Japan Aerospace Exploration Agency (JAXA), is part of the joint narratives featured on EO Dashboard, showcasing the power of open Earth observation data.


Air quality levels in the northeastern regions of India, China, and the U.S. are monitored and recorded daily -- all from the watchful eye of one satellite and its instruments, stationed 440 miles above Earth's surface.
As it is with many areas on the globe, the air pollution levels in northeastern India, China and the U.S. have changed significantly over the past two decades, specifically for air pollutants such as nitrogen dioxide (NO2) and sulfur dioxide (SO2).
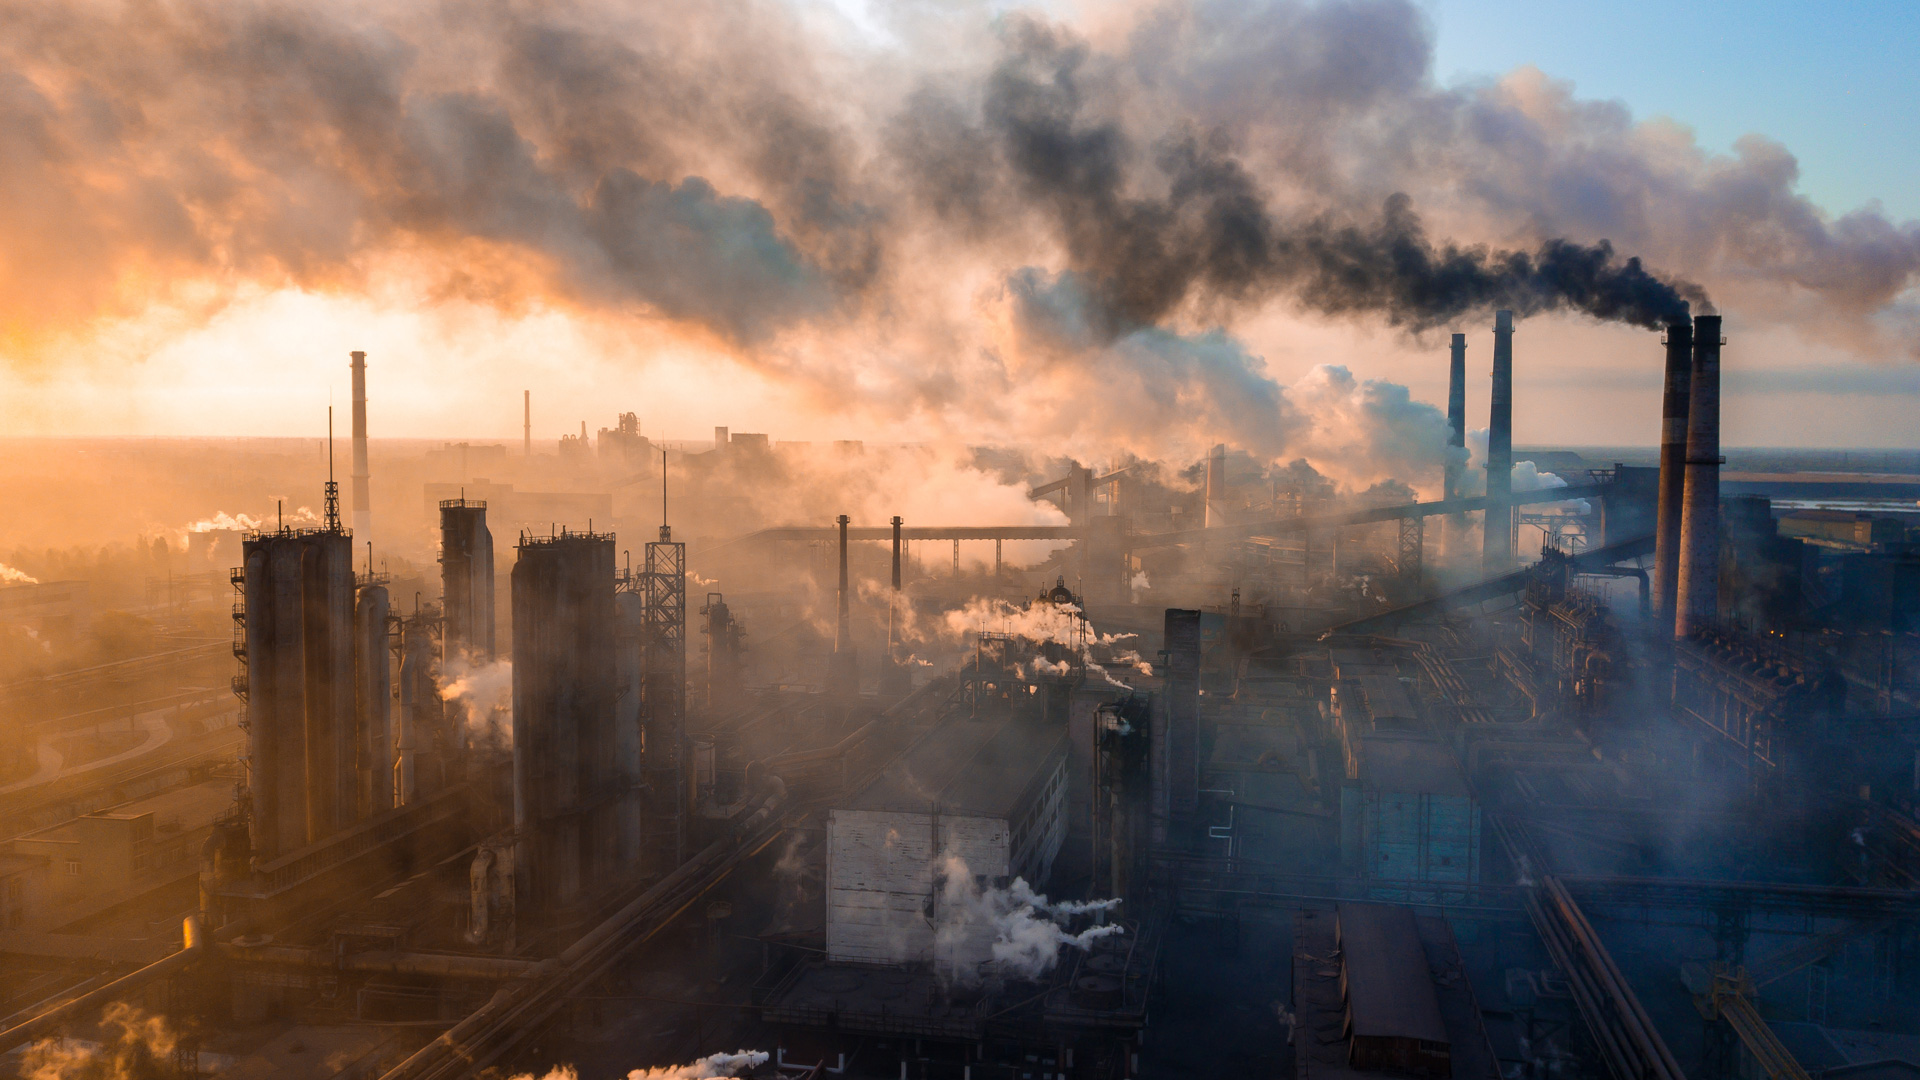
- Sulfur dioxide (SO2) is an air pollutant that leads to acid rain, haze, and many health-related problems. This pollutant is primarily produced through the burning of coal to generate electricity.
- Nitrogen dioxide (NO2) is a gas that is emitted into the air from the burning of fossil fuels. NO2 is injected into the atmosphere in the emissions from cars, trucks, buses, and power plants.
To better understand how NO2 and SO2 pollution is changing around the world, scientists are using data from the northeastern regions of India, China, and the U.S. for several case studies. These studies monitor changes in these pollutants over time and can inform the actions that attempt to clean the air.
Air pollution is now considered the world's largest environmental health threat, accounting for an estimated seven million deaths every year, according to the World Health Organization. Monitoring the gasses that produce air pollution provide data to help identify the sources of these pollutants, and potentially lessen their health impact.
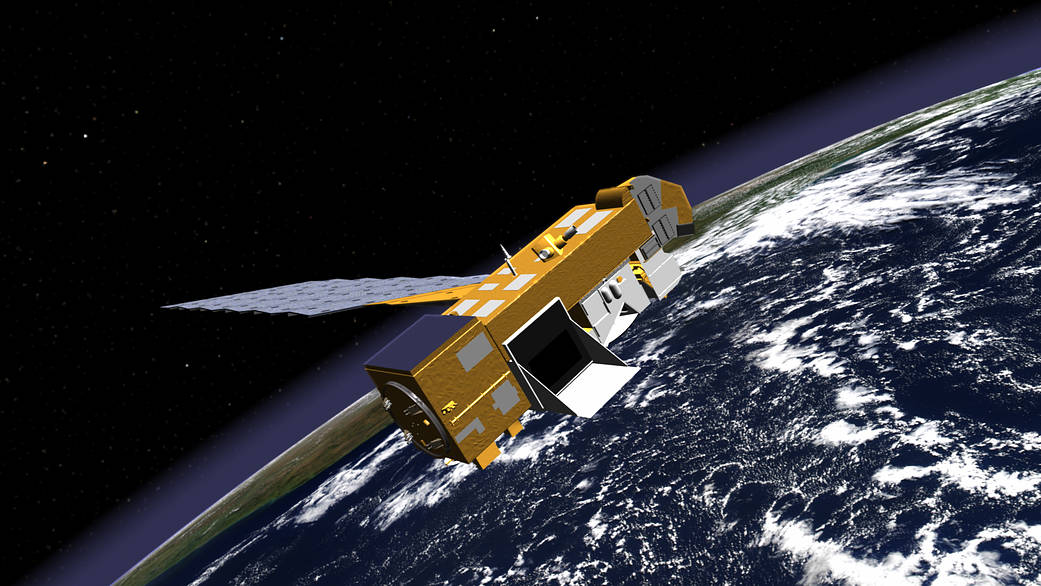
NASA scientists began monitoring and measuring nitrogen dioxide (NO2) and sulfur dioxide (SO2) in 2004. The Ozone Monitoring Instrument (OMI), stationed on NASA's Aura satellite, provides a unique insight on gasses such as NO2 and SO2, as well as aerosols, such as smoke, dust, and sulfates.
Since its launch, OMI data has seen hazardous gas emissions drop significantly in some areas, while rising in others. Scientists are using the images and data collected to better understand the role of human activities in these changes, and which changes occur through natural processes.
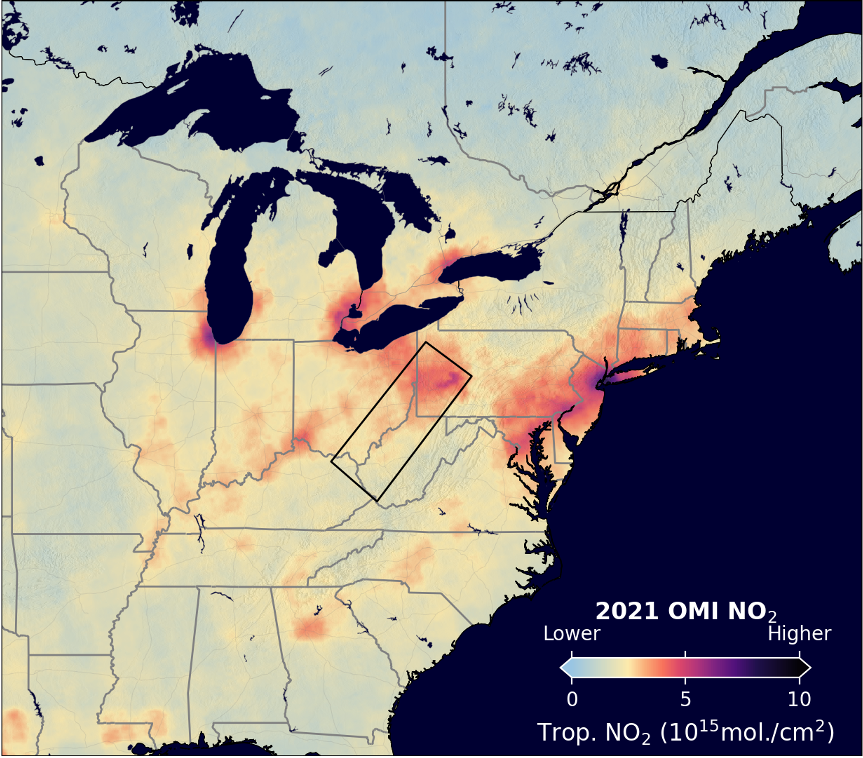
For example, this image shows decreases in SO2 and NO2 in the Ohio River Valley region of the United States. (Note: this website features an interactive tool that allows you to draw a box around areas of interest and see timeseries data for that region). The decreases in the U.S. can be attributed in large part to improved emissions from cars and trucks, as well as a reduction in the sulfur content in fuel. Some improvement is also the result of technology that does a better job of trapping nitrogen and sulfur oxides from power plant smokestacks.
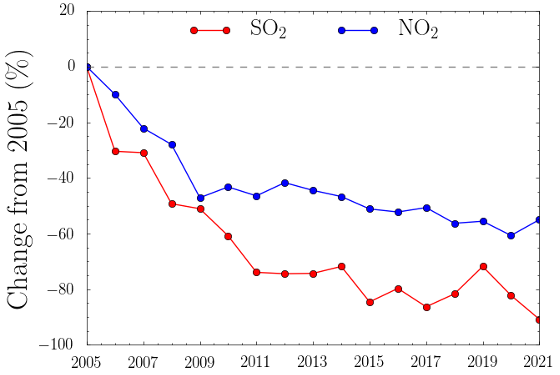
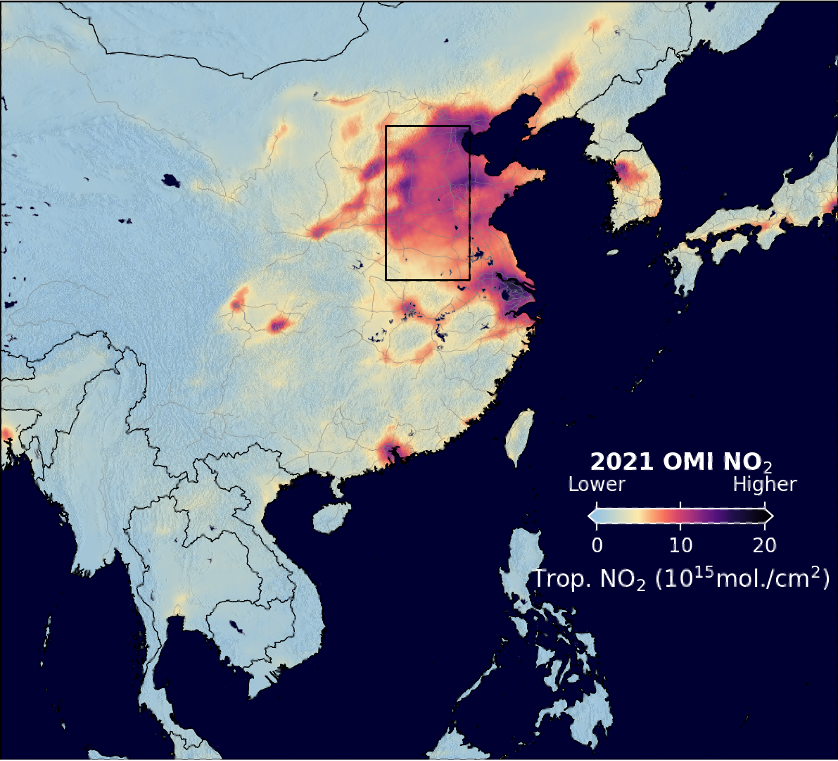
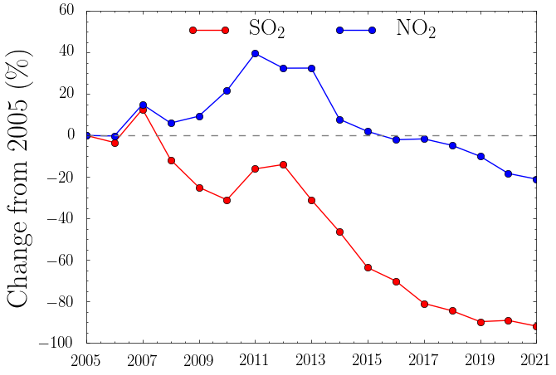
Satellite observations for northeastern China show a different story. The data for SO2 (red) show a 90% reduction in this pollutant from 2005-2021. The atmospheric levels of NO2 initially increased after 2005, then started to decrease after 2011. As of 2021 the atmospheric NO2 abundance is approximately 20% lower than at the start of the OMI record.
This highlights the different strategies and technologies employed to reduce these two pollutants. While SO2 primarily comes from coal and diesel fuel, the NO2 is released by all combustion sources and as a result a bit more difficult to control.
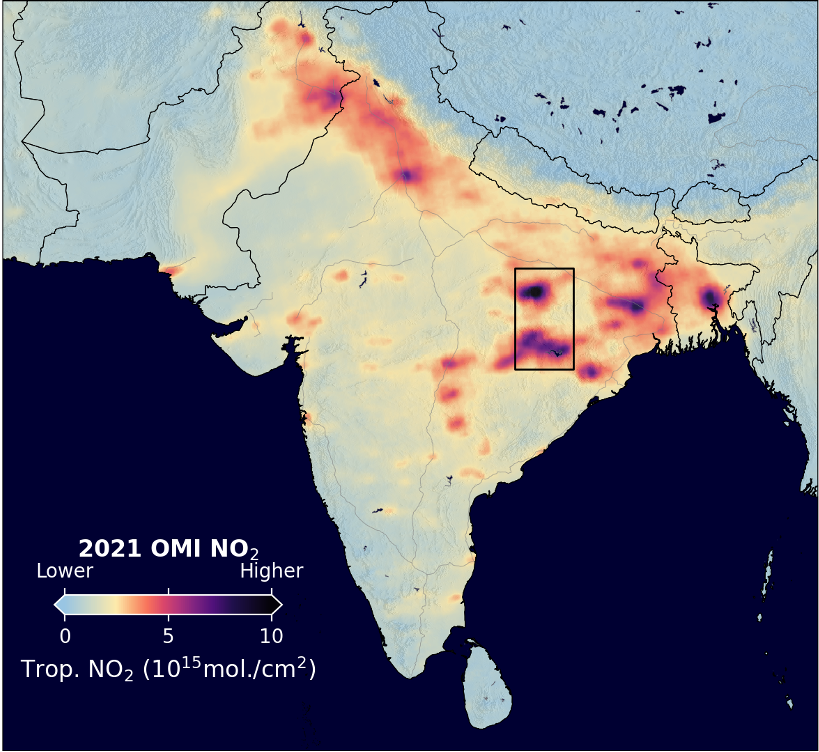
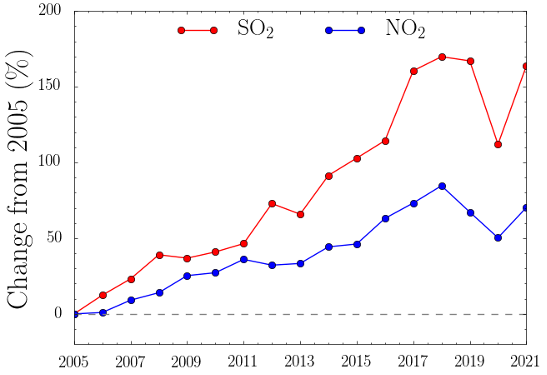
The timeseries charts for northeastern India show a steady increase for both NO2 and SO2 from 2005-2018, which then leveled off, perhaps due to the deployment of air pollution control technology. The significant drop in both SO2 and NO2 in 2020 is most likely the result of the prolonged COVID-19 lockdown in India that resulted in a reduction in fossil fuel combustion.
These observations represent almost two decades of daily air pollution data that show an increasingly clear picture of where the gas comes from and how the amount entering the atmosphere has changed over time and whether changes in air quality control are making a difference.
The Ohio River flows through or borders six states: Illinois, Indiana, Kentucky, Ohio, Pennsylvania, and West Virginia.
Nitrogen Dioxide yearly concentration in the Ohio River Valley in 2009
NASA satellite data has shown significant improvements in air quality over the Ohio River Valley, particularly a decrease in nitrogen dioxide (NO2) levels. This map illustrates the Nitrogen Dioxide for the year 2022. Further dates are available on the Dashboard.
Further datasets, including Carbon Monoxide, Nitrogen Dioxide, and Sulfur Dioxide from NASA's OMI are available on EO Dashboard:
These datasets are provided by NASA's VEDA EOAPI. The following Notebook illustrates how to access and work with the datasets to recreate the graphs illustrated in this story.
<iframe width="100%" height="400" src="https://esa-eodashboards.github.io/eodashboard-notebooks/notebooks/veda-api-bids-2023" frameborder="0"></iframe>