| cover-image | https://raw.githubusercontent.com/eurodatacube/eodash/c59adc7d580c6ced1f85a44c5bdd18bf94b3c9ee/app/public/data/story-images/SeaIce.jpeg |
|---|---|
| date | 2025-01-01 |
| theme | cryosphere |
| tags | arctic,ice,polar |
| official | true |
| collections | N12_sea_ice_concentration, SIC_sea_ice_thickness_cryosat, SIE_sea_ice_thickness_envisat, SITI_IS2SITMOGR4-cog |
This trilateral story, produced in collaboration by the European Space Agency (ESA), the National Aeronautics and Space Administration (NASA), and the Japan Aerospace Exploration Agency (JAXA), is part of the joint narratives featured on EO Dashboard, showcasing the power of open Earth observation data.


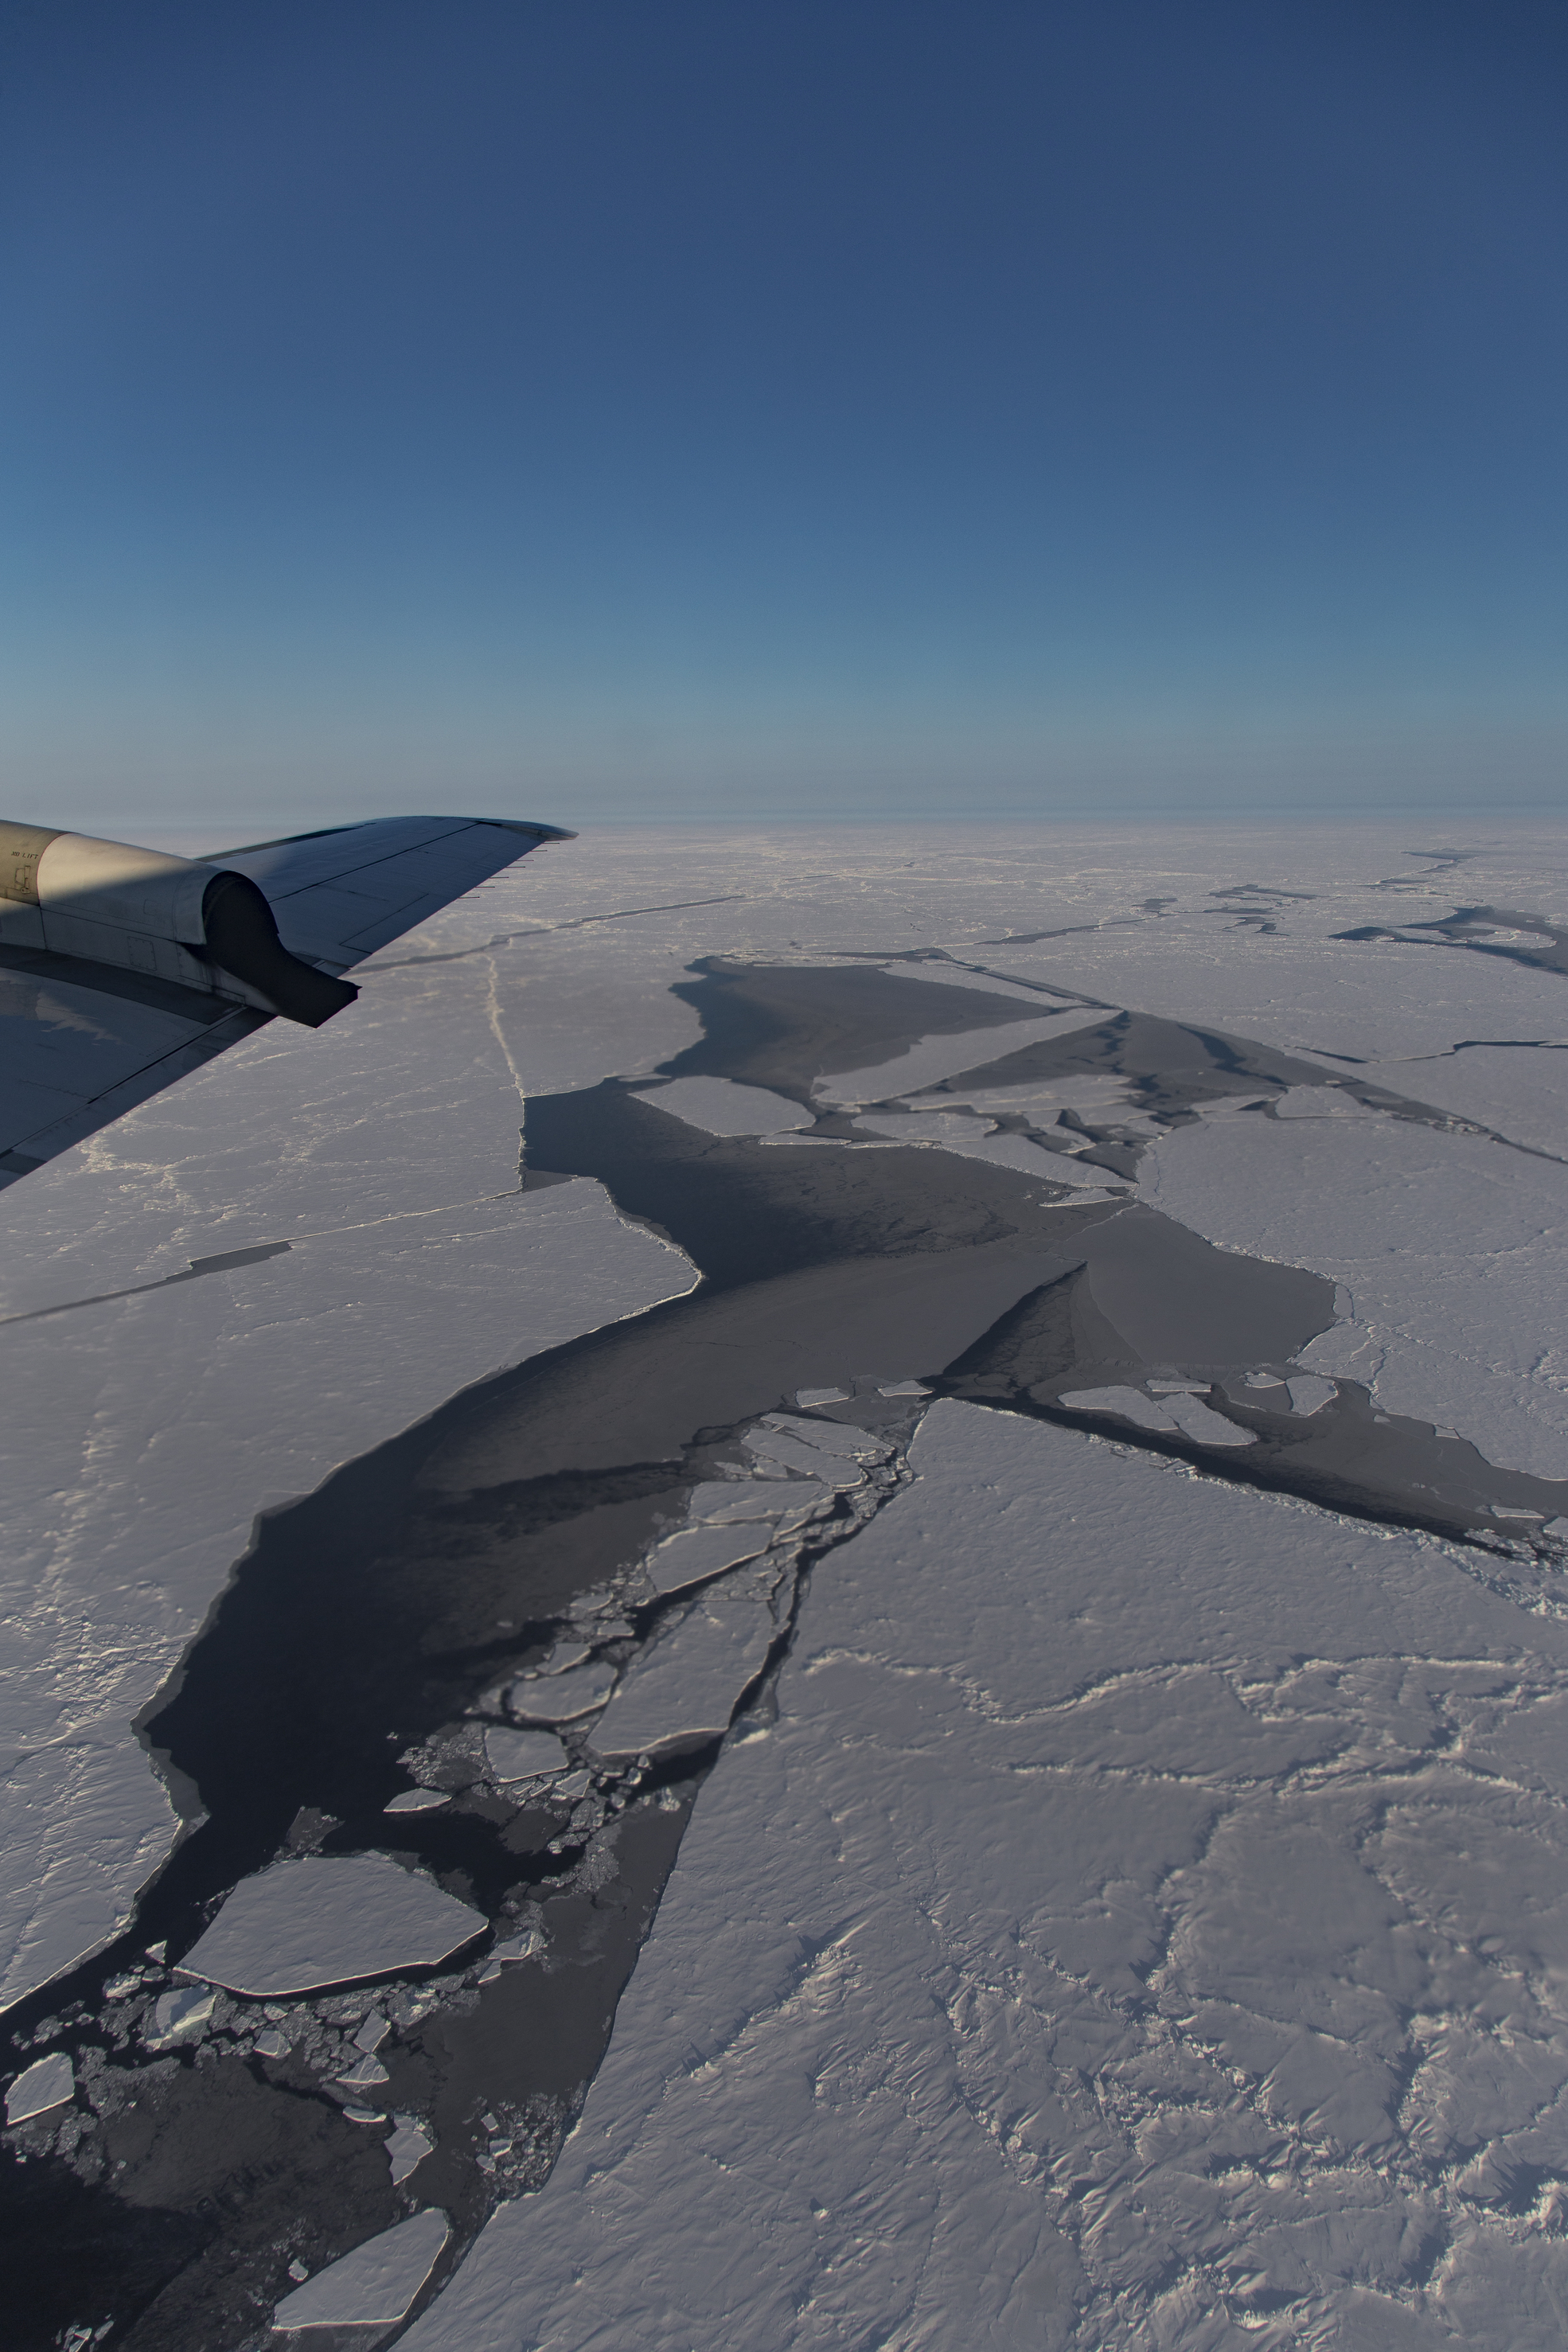
The sea ice extent has been rapidly decreasing in recent years as global temperatures have risen. As sea ice extent is very important, space agencies are continuously monitoring it from space. Microwave remote sensing from space is the only tool that provides continuous, consistent, and comprehensive information on sea ice changes in polar regions. JAXA provides data of a variety of satellite measurements from passive microwave imagers, including the Advanced Microwave Scanning Radiometer (AMSR) series. These data aim to capture sea ice concentration (i.e., coverage) and sea ice extent trends in the polar oceans on a daily basis from 1978 to the present.
JAXA’s GCOM-W satellite, carrying the AMSR2 microwave sensor (1450 km swath, 7 bands), circles Earth daily to “see” sea-ice even through clouds and polar night.
Its data are averaged into a handy Level-3 map on a 0.1° grid, showing—at a glance—how much of every Arctic and Antarctic square is ice-covered (0 % = open water, 100 % = solid ice).
On EO Dashboard users can explore over 12 years of GCOM-W products of sea ice concentration, as illustrated in the images below. The entire time series can be explored here.
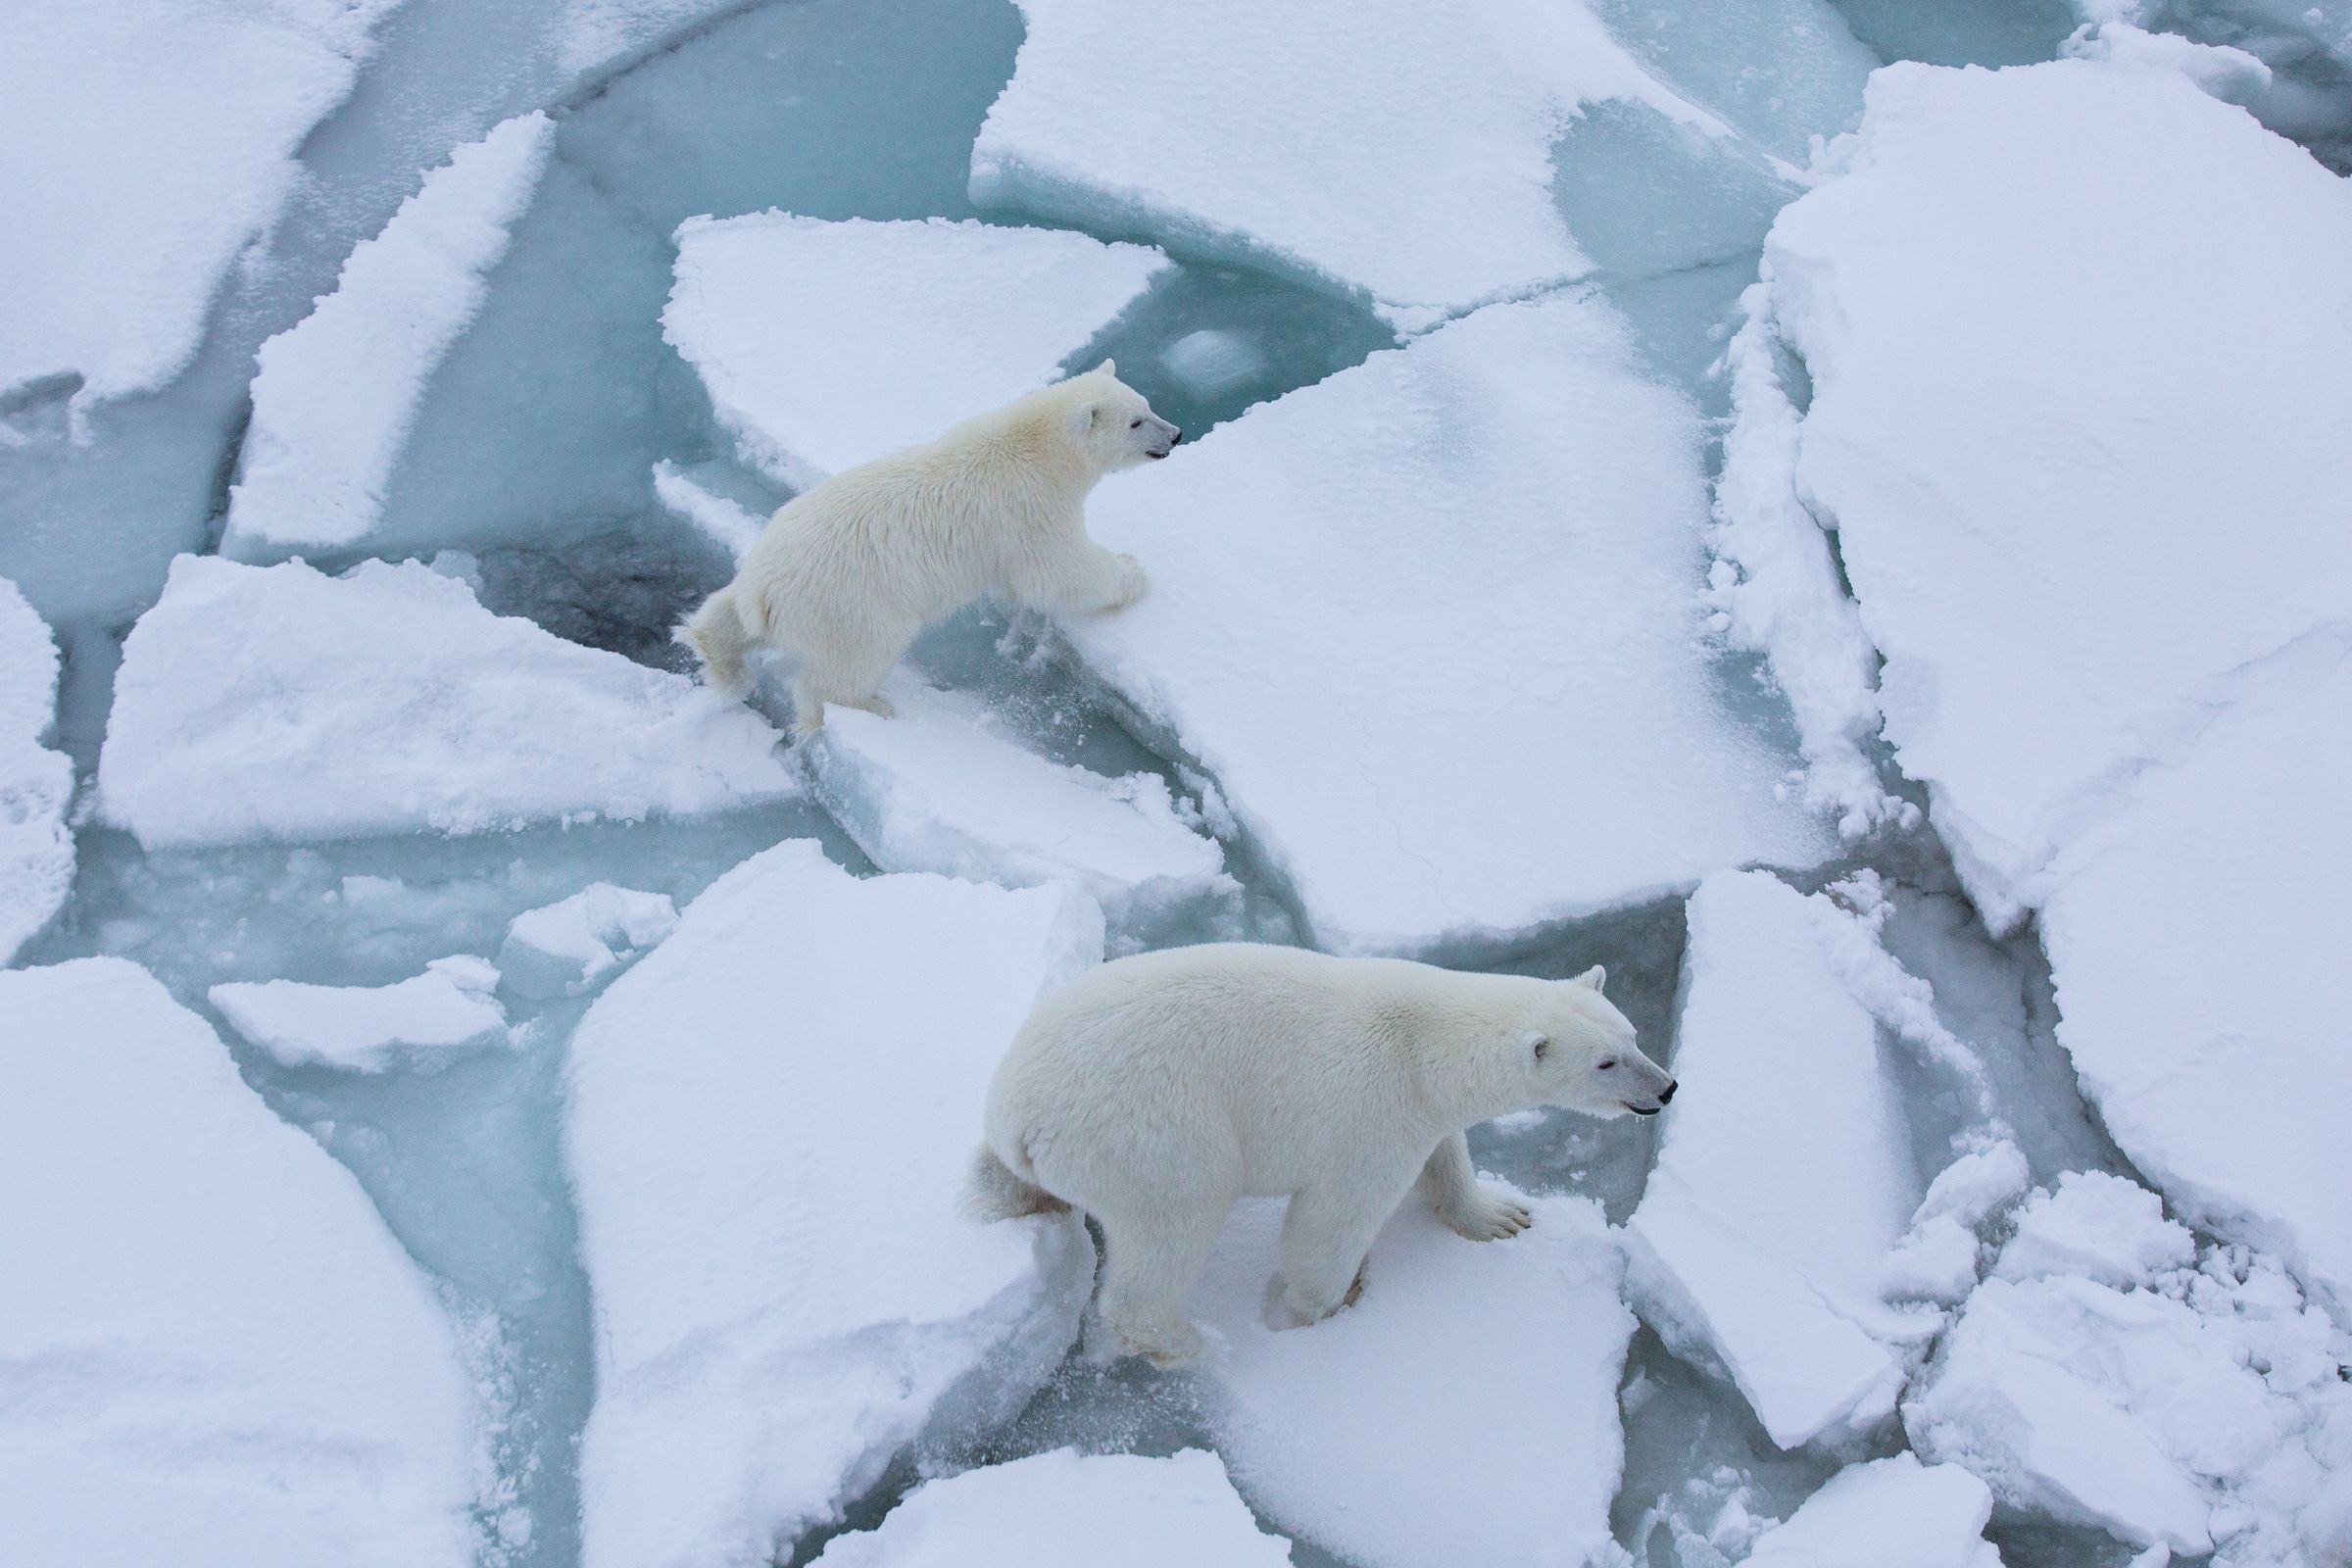
In general, snow and ice (i.e., the cryosphere) are widespread in the Arctic region. They are sensitive to temperature changes and are the first to show signs of warming. Since snow and ice are white, they have higher albedo, which helps to cool the Earth by efficiently reflecting solar radiation. When sea ice melts and disappears, the darker sea surface is exposed and albedo decreases. As the albedo decreases, absorption of solar radiation is enhanced. Therefore, the sea surface warms, and the air temperature rises. In addition, as the supply of water vapor increases, its contribution to radiative forcing is likely increased. These effects of the warm-melt cycle are called ice-albedo feedback. Ice-albedo feedback causes what is termed Arctic amplification which alters the radiation balance and causes larger changes in air temperature. As a result, drastic changes in the cryosphere have caused air temperatures in the Arctic region to rise significantly in comparison with other areas of the globe.
Due to recent climate change, global warming has progressed rapidly. The Arctic region shows changes most characteristic of this warming. These changes are expected to further accelerate due to the ice-albedo feedback. It is possible that they will soon reach a tipping point where the future changes will no longer be stoppable. In addition, atmospheric exchange between the Arctic region and mid-latitude regions will be more active with possible increases in extreme weather events such as cold winter or heavy rain in the mid- and high-latitude regions. Therefore, it is necessary to monitor the sea ice continuously.
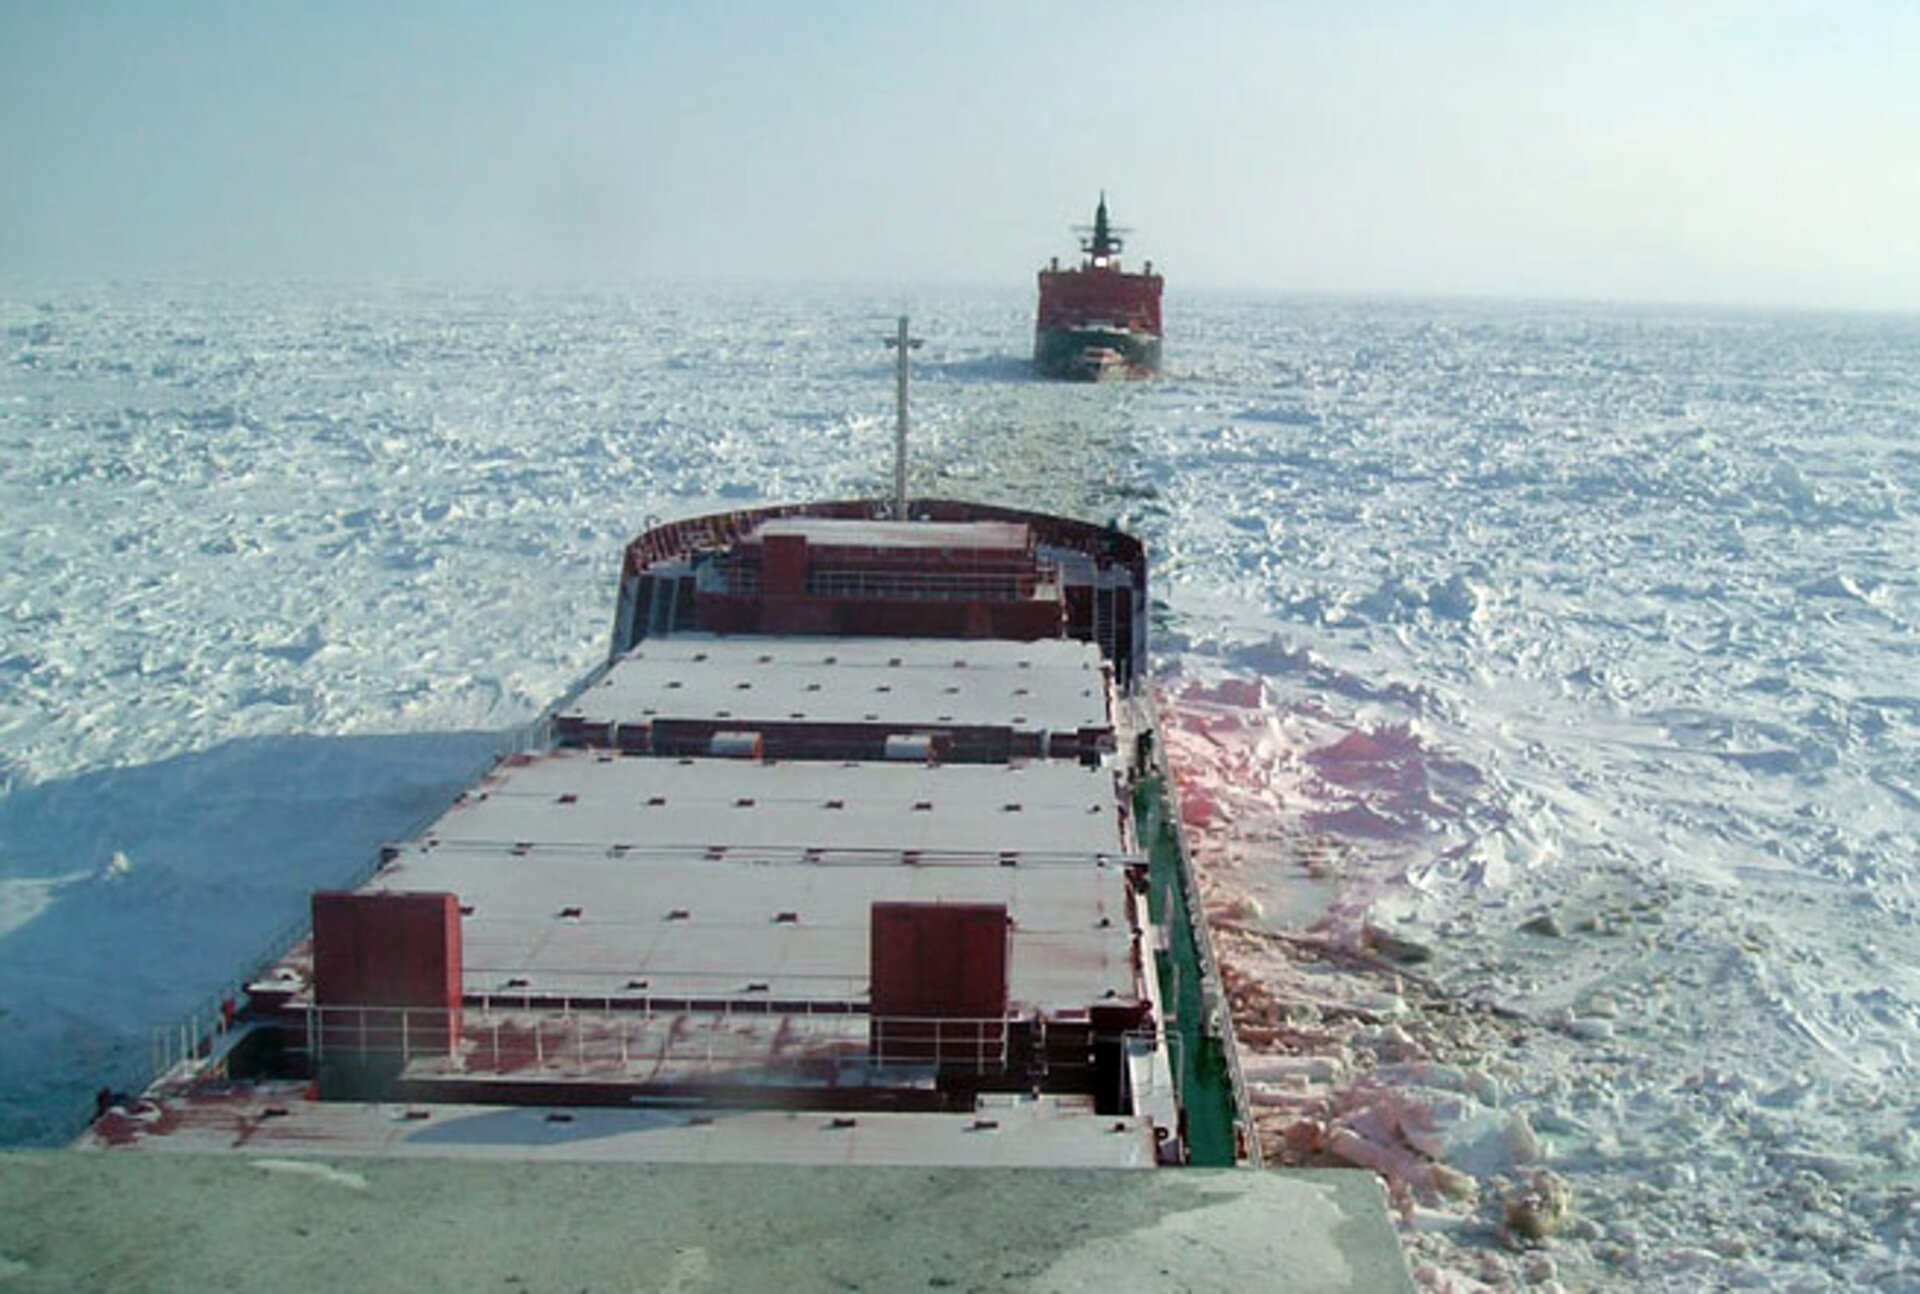
From an economic standpoint, the sea ice extent decline has increased the commercial availability of the Arctic Ocean, an area previously closed by sea ice. The expansion in the open ocean area will allow vessels to navigate the Arctic Ocean through what is called the Northern Sea Route. There are two routes through the Arctic Ocean: the northeastern route along the Russian coast and the northwestern route along the Canadian coast. In particular, the northeastern route is beginning to be used for commercial operations because it is about 30% shorter than the traditional route between Europe and Asia via the Suez Canal.
Vessels navigating the Arctic Ocean must be equipped with ice resistance and ice breaking capabilities. Appropriate routes must be selected according to ship specifications and sea ice conditions. Information about sea ice concentration is necessary for the safe and economical navigation of vessels. As increased shipping brings additional risks to the severely vulnerable environment and, consequently, risks of increased environmental changes in other regions, adverse impacts on the environment resulting from the opening in the Northwest Passage route must be monitored as shipping traffic increases.
Scientists use a variety of satellites and instruments to monitor and analyze changes in sea ice cover and thickness. Advances in satellite technology enable scientists to monitor and measure sea ice characteristics at a level of detail that cannot be obtained from ship-based or airborne measurements. Over time, continuous data collected by satellite observations help build a record of changing sea ice conditions over time and help people in Arctic coastal regions forecast storms and anticipate changes in walrus populations and shipping routes.
This narrative provides access to interactive maps of Sea Ice Thickness and Sea Ice Concentration. Access these datasets by clicking on the EXPLORE DATASETS button at the top of the page or directly from the links below: