| cover-image | https://raw.githubusercontent.com/eurodatacube/eodash/c59adc7d580c6ced1f85a44c5bdd18bf94b3c9ee/app/public/data/story-images/12-ship-traffic.jpg |
|---|---|
| date | 2025-01-01 |
| theme | agriculture |
| tags | crop,food,supply |
| official | true |
| collections | N6_geoglam |
This trilateral story, produced in collaboration by the European Space Agency (ESA), the National Aeronautics and Space Administration (NASA), and the Japan Aerospace Exploration Agency (JAXA), is part of the joint narratives featured on EO Dashboard, showcasing the power of open Earth observation data.


Advances in satellite monitoring deliver a treasure-trove of data that scientists study and analyze for the betterment of humankind. These discoveries can help identify trends that better predict occurrences such as climate change and global warming. Since 2020, researchers at the European Space Agency, (ESA), the Japanese Space Agency, (JAXA), and NASA have been working together on a joint dashboard to combine their satellite data and openly share findings in an effort to elevate and protect the quality of life for the global population.
Providing insight into agricultural production, crop conditions, and food supply are among some of the most impactful information afforded by Earth observing satellites. Information derived from the data retrieved can affect the price we pay at grocery stores, policy implementation from regional to global scales, and food security around the world. Not only can satellite data tell us about current and near-future food and commodity crop conditions, but researchers are also studying the long-term trends in climate change and its effects on our food supply in support of agricultural resilience.
As demonstrated by recent global crises including the COVID-19 pandemic and the ongoing Russian war in Ukraine, the globally interconnected nature of the agrifood system has been thrust into the spotlight. These extreme disruptions to the global food supply underscore the importance of global agriculture monitoring, both of major producing countries and those who are major importers and therefore most vulnerable to food insecurity. A key example of international coordination in support of better food information is the G20 GEOGLAM Crop Monitor developed in response to a request from the G20 Agricultural Market Information System (AMIS). The Crop Monitor provides a public good of open, timely, science-driven information on crop conditions in support of market transparency. The GEOGLAM Crop Monitor Initiative are supported by the global agriculture community and national space agencies - including the NASA Harvest Consortium and US-based institutions, JAXA and JASMIN, ESA and several European institutions, ministries of agriculture across the globe and many more. It reflects an international, multi-source, consensus assessment of crop growing conditions, status, and agro-climatic factors likely to impact global production, focusing on the major producing and trading countries for the four primary crops monitored by AMIS (wheat, maize, rice, and soybean) as well as on the countries most at risk to food insecurity and their primary staple crops.
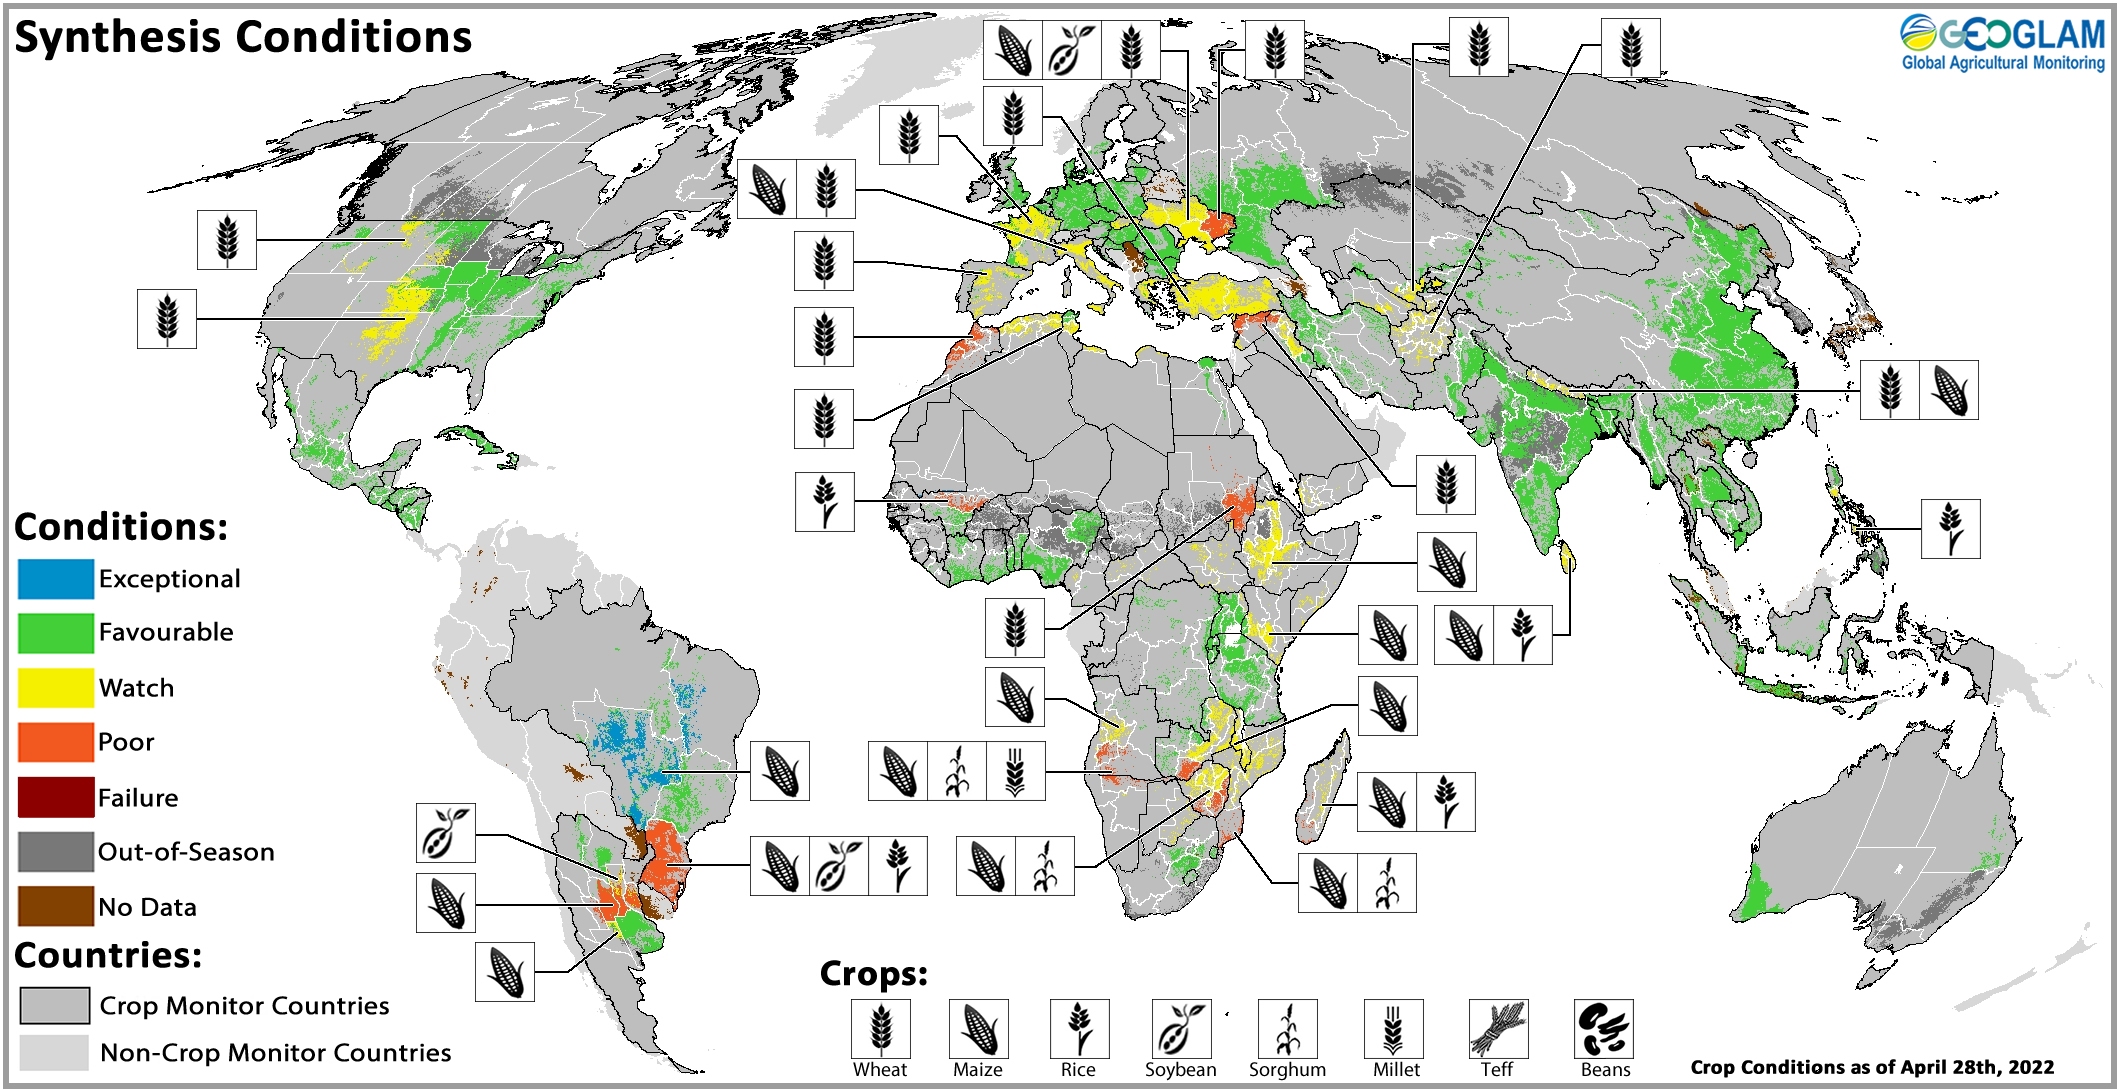
The following map illustrates the global crop conditions for January 2022. More dates are available on the Dashboard.
Any extreme event such as conflict, severe weather, or environmental abnormalities pose threats to agricultural production and may shock the system which is why it is so critical to have them accessible, transparent, timely, and global information afforded by satellite data. For example, based on community consensus and available satellite data we understand that at the end of February 2022, conditions are generally favourable for wheat and rice production, while mixed for maize and soybeans. We also know that winter wheat is mostly dormant in the northern hemisphere, with some areas of production raising some concern in Europe, Ukraine, and the US. In the southern hemisphere, maize is under mixed conditions in Argentina and southern Brazil. While rice conditions are favourable in most countries except for Vietnam and Brazil, soybeans are under mixed conditions in Argentina and southern Brazil. Satellite data helps us monitor these global crop conditions on a regular basis, especially in times and places where ground access is dangerous or limited.
GEOGLAM Crop Monitor for AMIS and Early Warning synthesis map showing where crops are grown around the world, and the crop conditions as of April 28, 2022. (source: https://cropmonitor.org/)
With the help of satellites, we are able to monitor crops throughout the growing seasons and can use a combination of satellite derived time series to quantify critical indicators related to crop health for a specific region and crop over time. One such example of satellite-derived products are the GEOGLAM-NASA Harvest Agrometeorological (AGMET) Earth Observation Indicators, which are supported by the global remote sensing community and updated every 7-12 days to ensure that users are provided with the most up to date information. Displaying climate, environmental, and vegetative variables that impact agricultural outcomes, the AGMET Indicators were born from an agricultural stakeholder-identified need for a simple way to visualize and frequently monitor crop health with the ultimate goal of identifying potential cropping concerns as the growing season progresses and before a food shortage materializes. Satellite data provides a wealth of information to meet these needs including Agromet parameters:
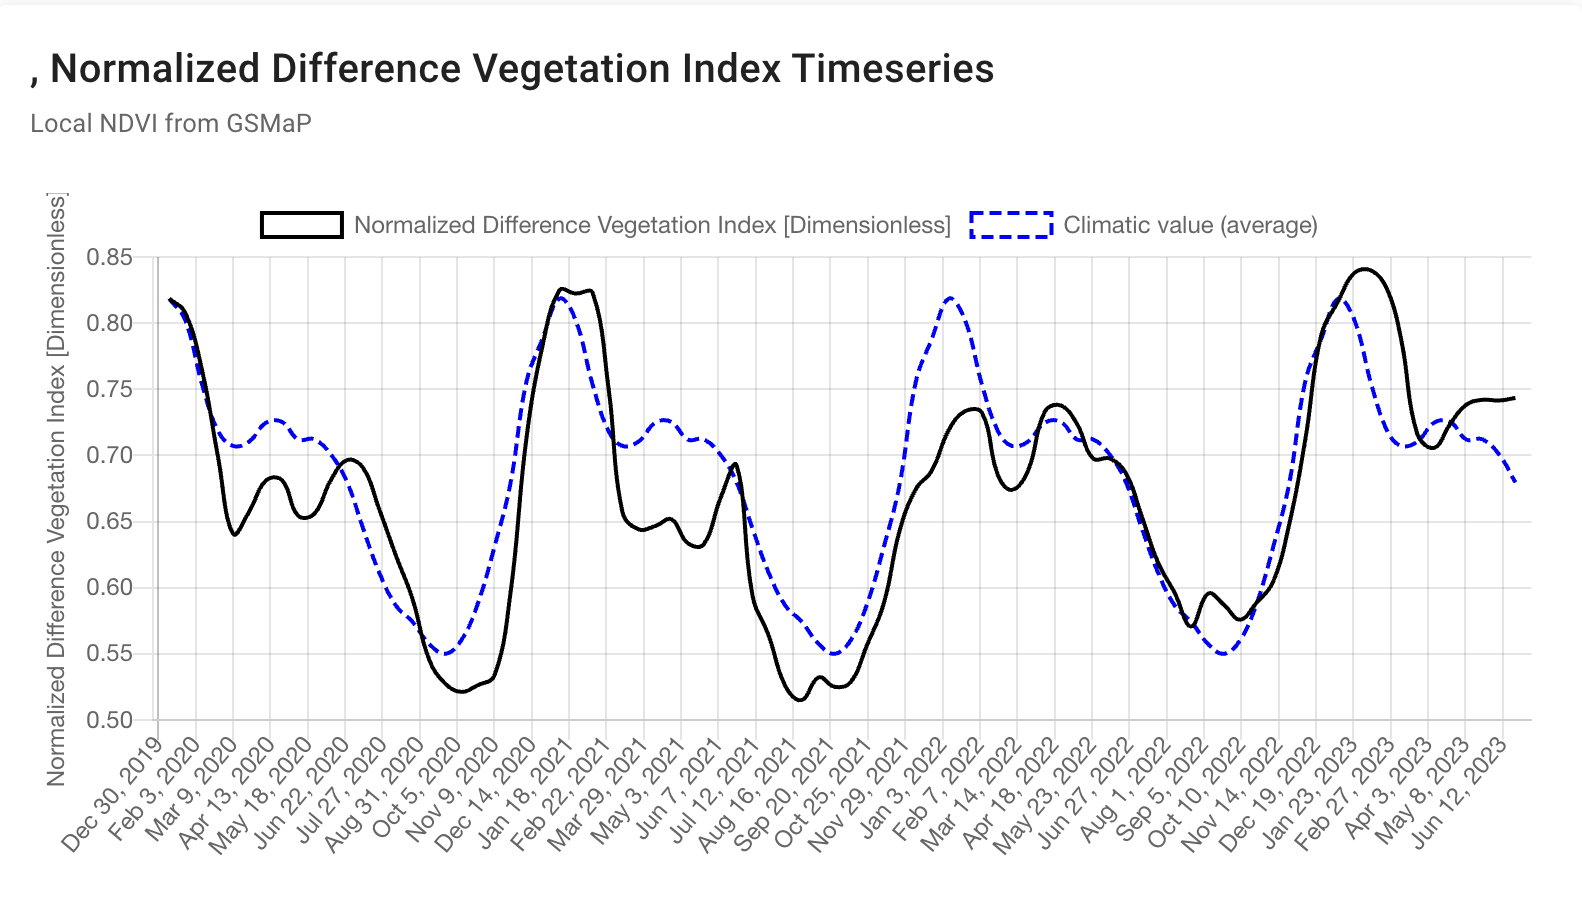
Showing global normalized difference vegetation index (NDVI) is a simple graphical indicator that can be used to analyze remote sensing measurements, often from a space platform, assessing whether or not the target being observed contains live green vegetation. As a crop season progresses, NDVI values will increase during early crop growth and development of leafy vegetation, will reach the peak as the crop fully develops and reaches maturity (before senescence), and then will decrease again as the crop matures and as the leafy vegetation begins to die off. How the NDVI values progress over the course of the season and the individual peak values can help predict the productivity of the crops and be compared to previous seasons.
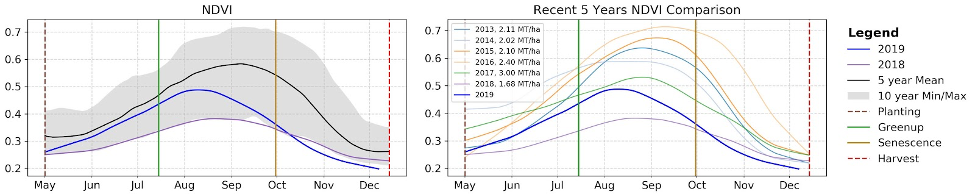 The AGMET Indicators use satellite data to measure key indicators of crop health, including NDVI and NDVI anomalies. (source: https://cropmonitor.org/tools/agmet/)
Like NDVI, surface soil moisture is a key component for crop production that can be measured using satellite data (such as ESA’s SMOS instrument, JAXA’s GCOM-W instrument and NASA’s SMAP instrument). The amount of moisture in the soil will depend on meteorological conditions that can also be measured with the help of satellite data (precipitation, temperature, etc.) as well as sun exposure, wind, runoff/drainage, and soil type. If there is less water in the soil, it will be more difficult for crop roots to take up that water, resulting in a crop that is under greater stress. If the stress continues, the crop will wilt and eventually die. However, if the soil is above field capacity and the pores are oversaturated with water, then oxygen levels are restricted and it can be detrimental for the crop. This is why soil moisture is a key indicator of what may ultimately be a successful or failed crop.
These are just a few examples of the types of measurements that satellite missions can provide, but just as important as the information itself is how we analyze it and apply it. Because of the global coverage, frequent revisit rate, and repeatability of satellite data, we are able to successfully explore food security questions, climate change affects, and agricultural production around the world.
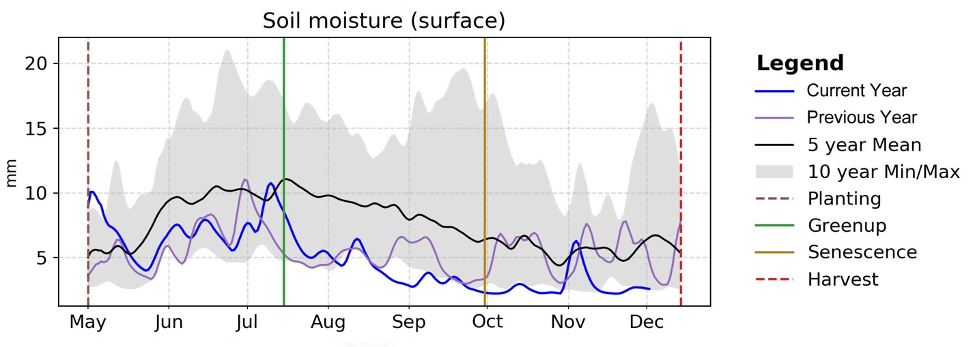 Soil moisture can be measured using satellite data and directly affects crop growth. (source: https://cropmonitor.org/tools/agmet/)
The Southern Plains are a major wheat producing region in the U.S. and is monitored closely from planting to harvest given the importance of this major commodity crop. The AGMET Indicator graphic for the 2022 Southern Plains winter wheat season (above) shows below-average cumulative precipitation, NDVI, and soil moisture, consistent with drought conditions trending throughout the Southern Plains. U.S. winter wheat is typically harvested over the summer months but due to the drought conditions affecting the region, there is concern over the potential yields. With the help of satellite data, we understand several months ahead of the harvest that we might expect lower than average production as a result of the environmental indicators measured. With this knowledge comes the ability to respond and prepare appropriately while simultaneously providing market transparency.
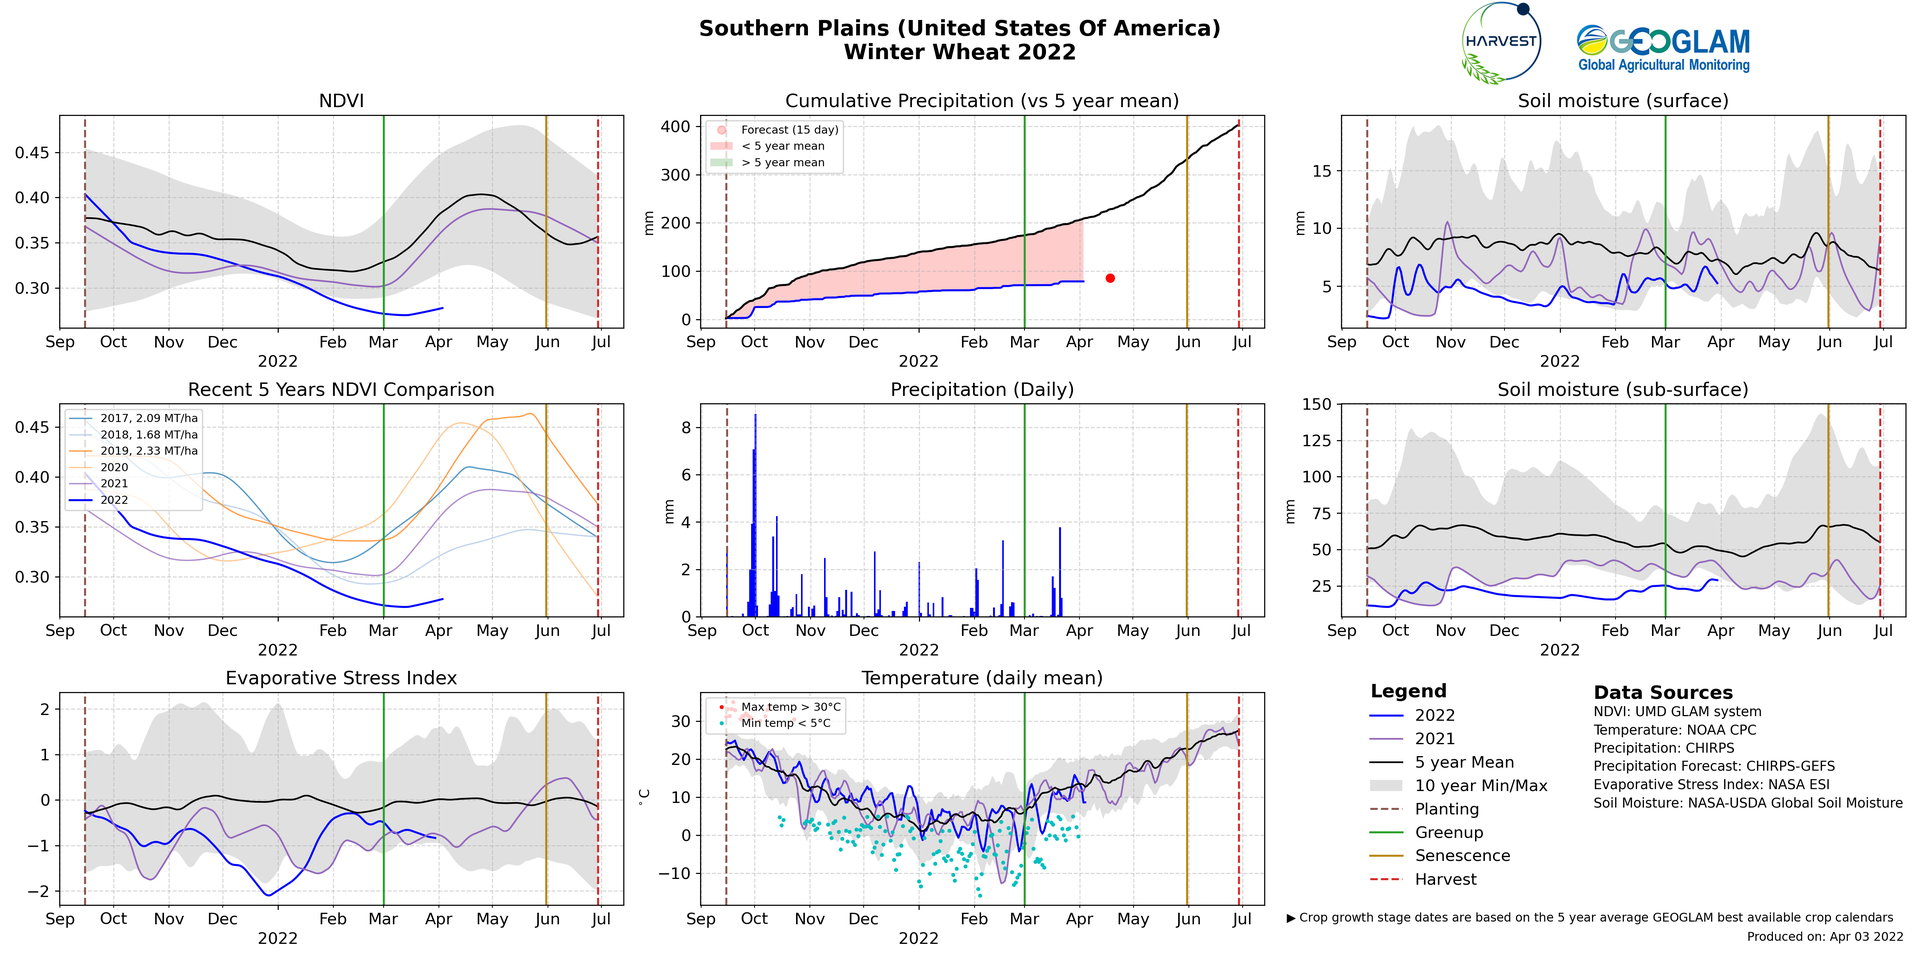 Southern Plains (USA) Winter Wheat 2022
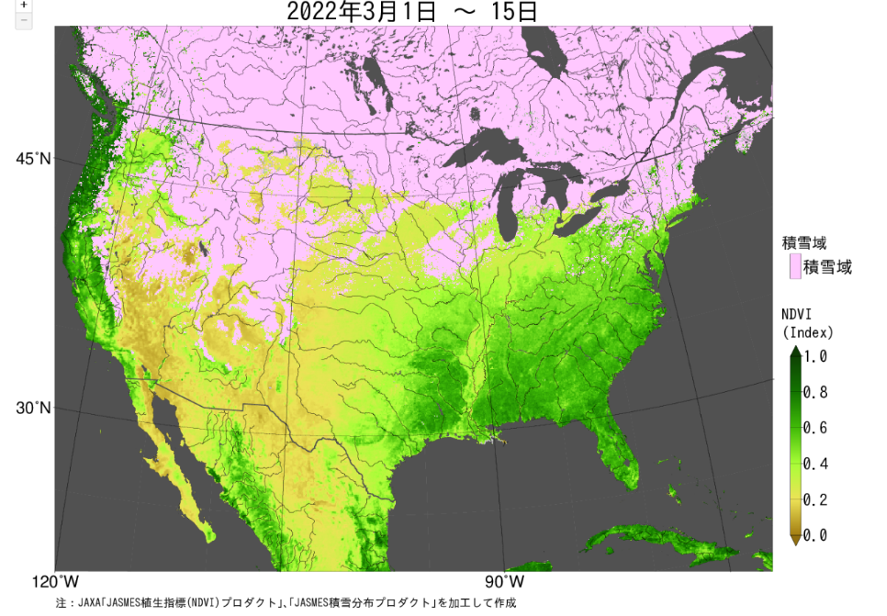
JAXA with Japanese MAFF provide agrometeorological information including Precipitation, Drought Index, Soil Moisture, Solar Radiation, Surface Temperature, Vegetation Index and anomaly, etc. Rainfall, Agriculture, Land, GPM Core Observatory, SHIZUKU (GCOM-W), MODIS, Multiple Satellites (GSMaP) bi-Monthly on JASMIN for Asia and on JASMAI for selected world areas. By using JAXA WMS with JASMIN/JASMAI products, the anomaly of Southern Plain in the US can be zoomed in with visualized map. The following are examples of composite averaged NDVI and NDVI anomaly.
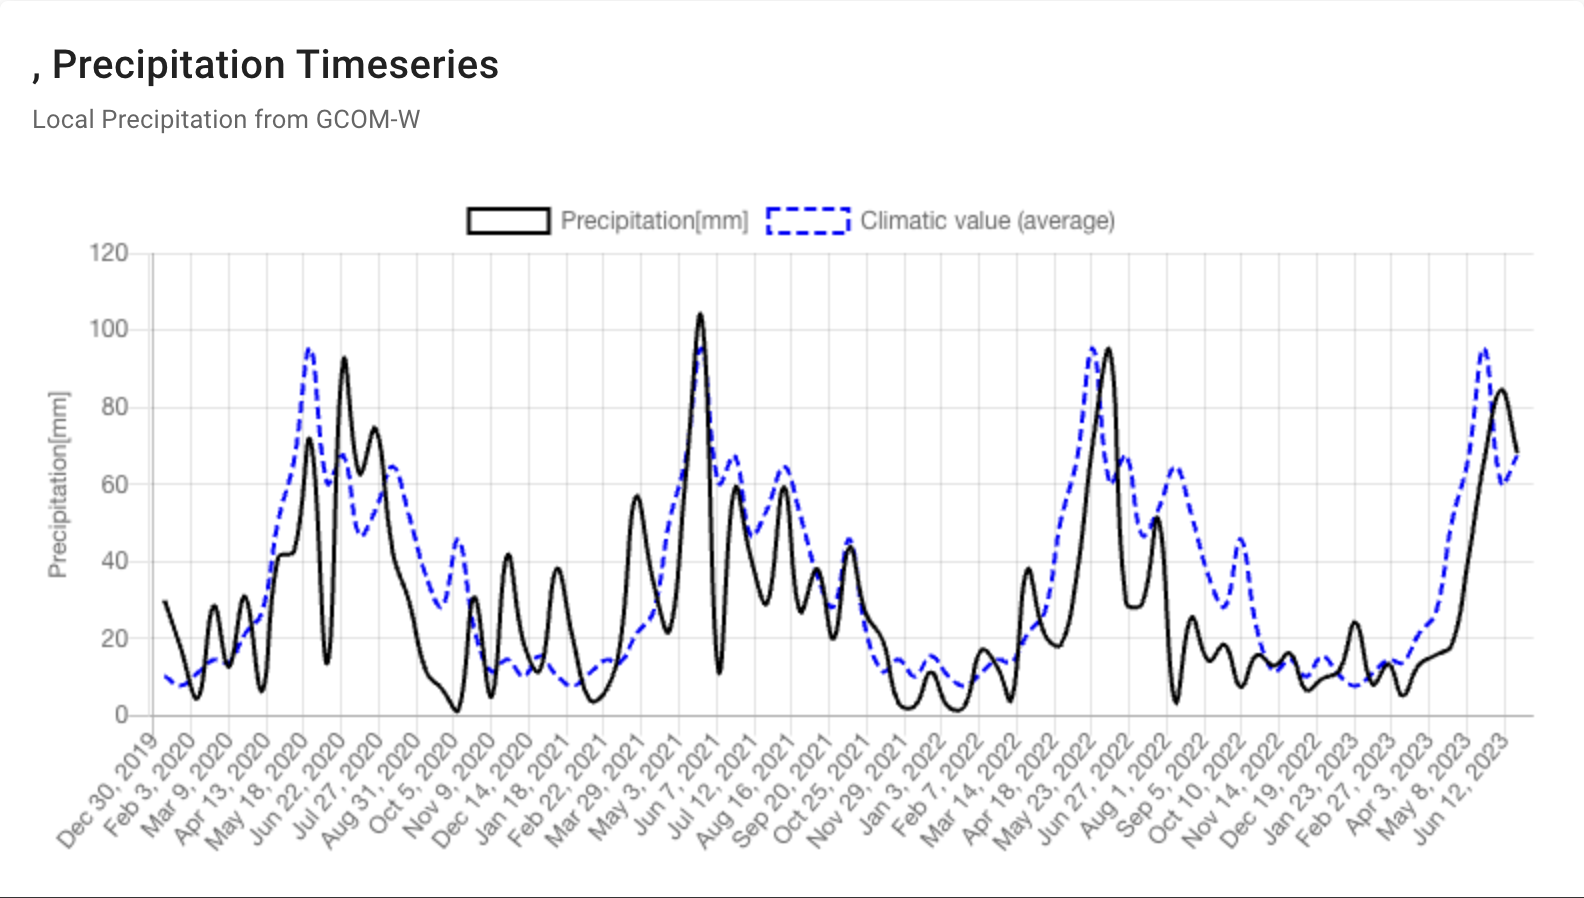
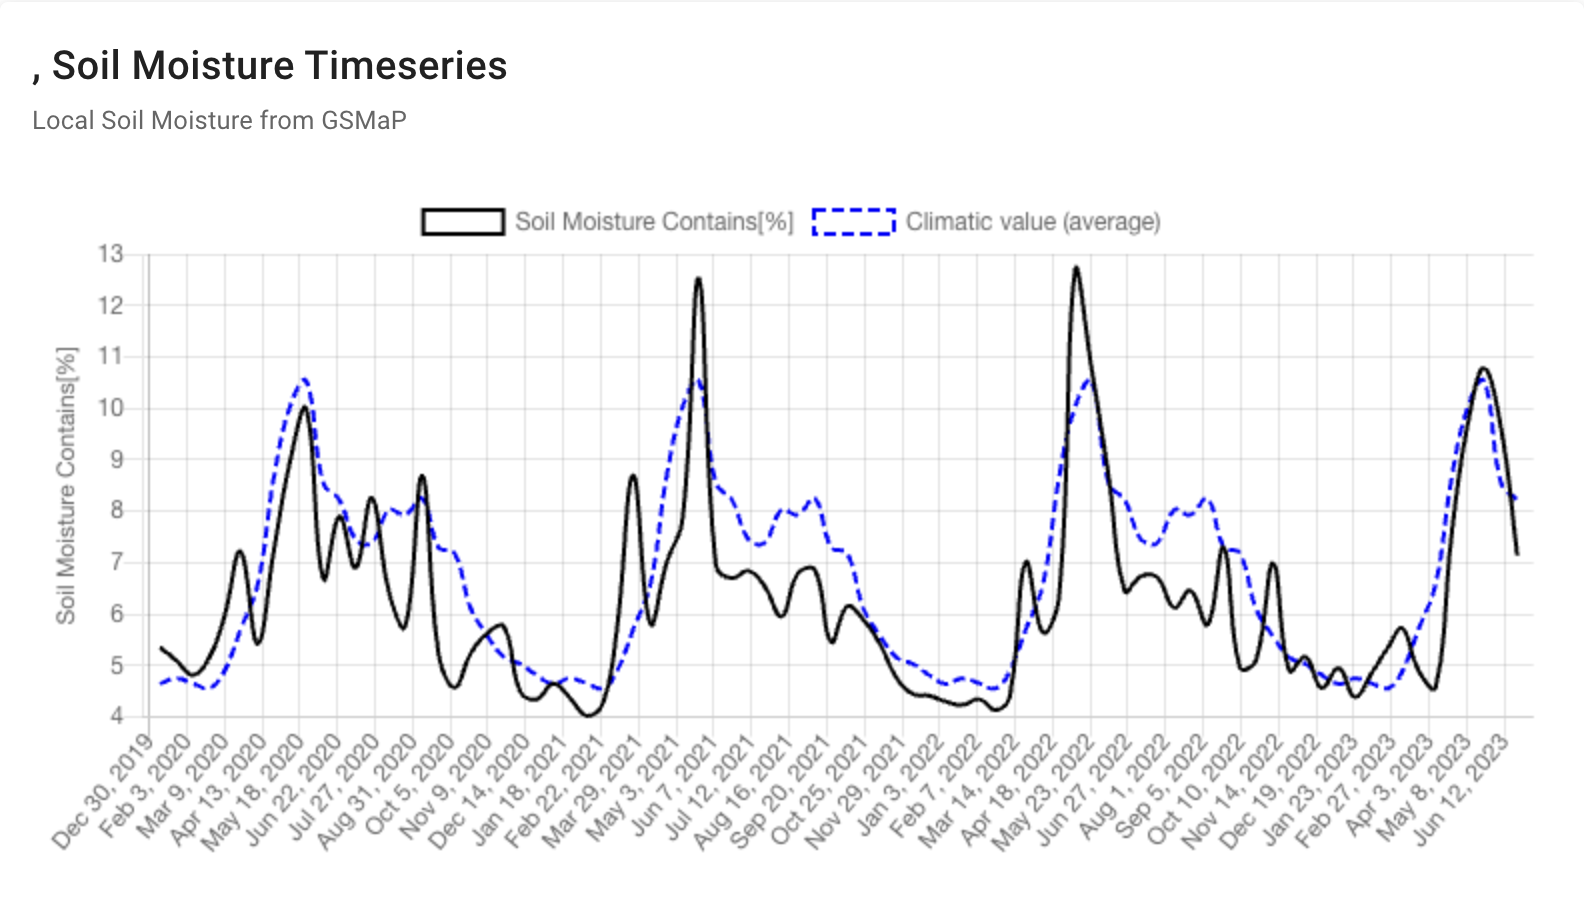
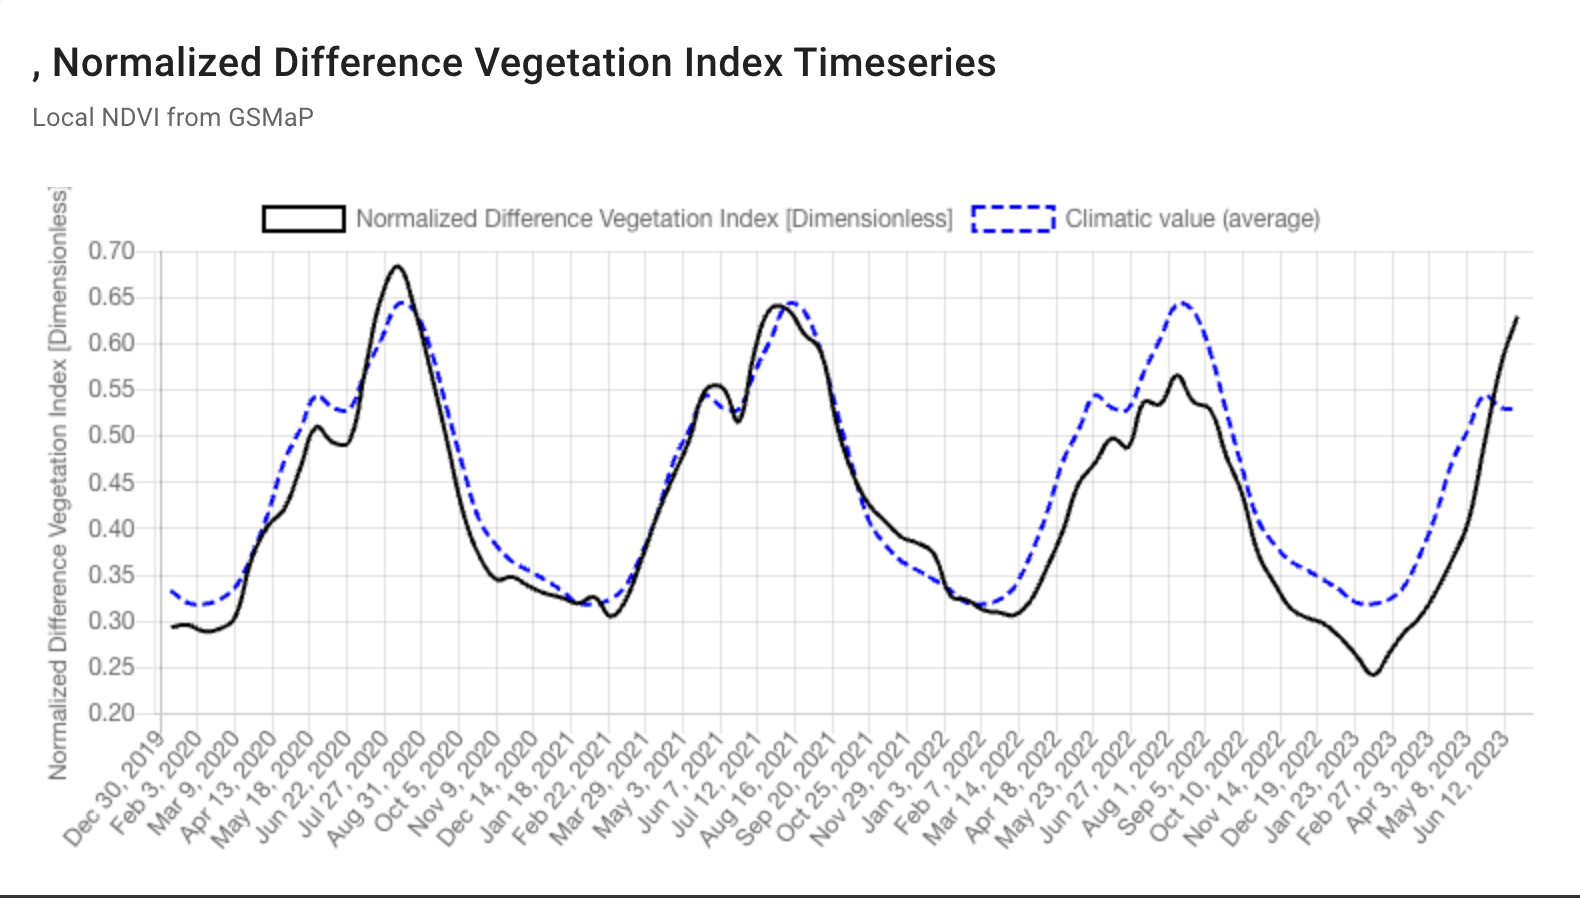
The following time series indicators reflect the precipitation, soil moisture and NDVI variables from Japan JASMIN/JASMAI for Kansas, USA.
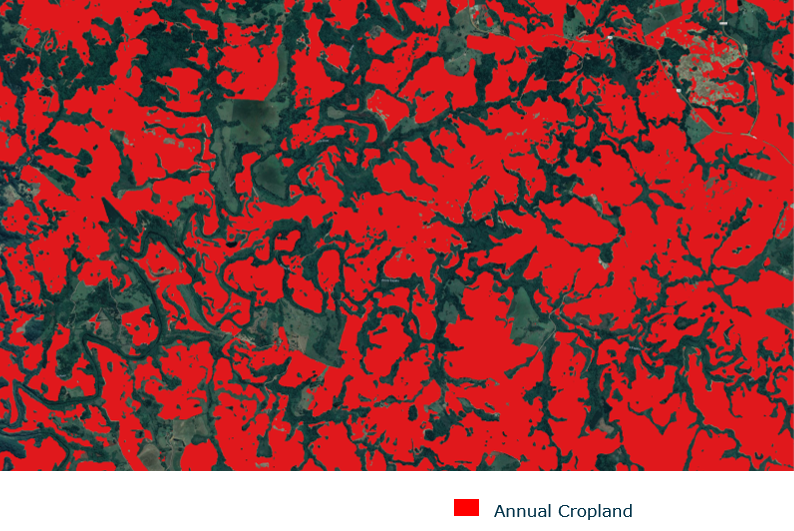
WorldCereal is a global Research and Development challenge aiming to engage the global agricultural community to achieve optimal results. WorldCereal relies heavily on satellites, primarily the operational time series of the Copernicus Sentinels missions, which allow an unprecedented dynamic crop monitoring at global scale. By focusing on maize and wheat during the system demonstration, WorldCereal aims to contribute to the global food security challenge as together with rice, these crops form the world’s most widely cultivated species, accounting for an estimated 42.5 percent of the world’s food calorie supply (FAO).
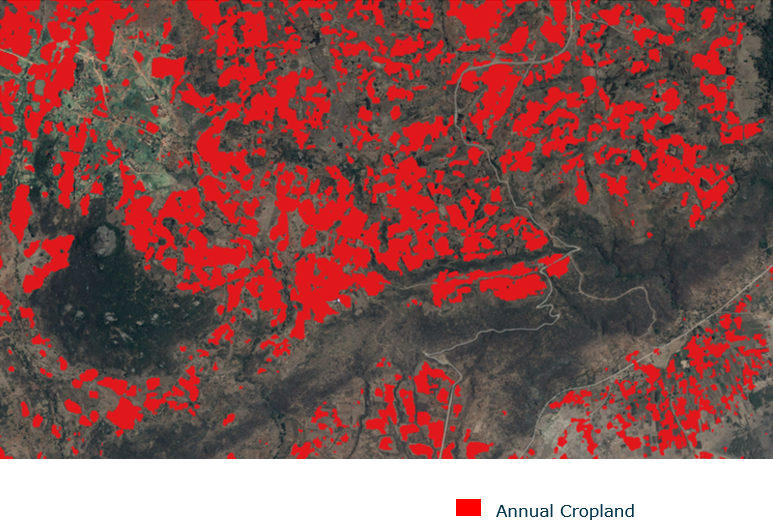
The WorldCereal project produced the first seasonally updated temporary crops, crop type, and irrigation maps at 10-meter spatial resolution and at global scale. The product collection can be accessed at: https://esa-worldcereal.org/en/products/global-maps.
Here we present a few examples of satellite based products for agricultural monitoring accross the world. Use cases look at Tanzania, North Africa, Middle East, and Brazil.
Annual Cropland
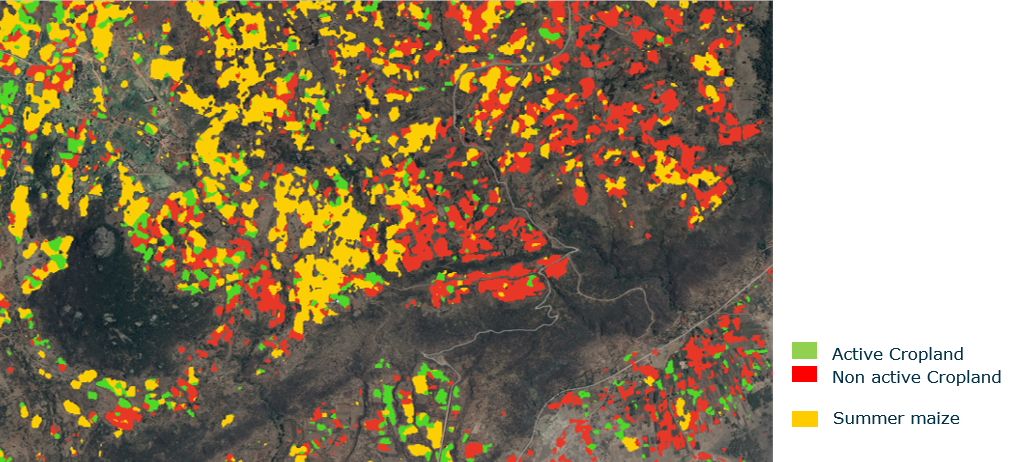
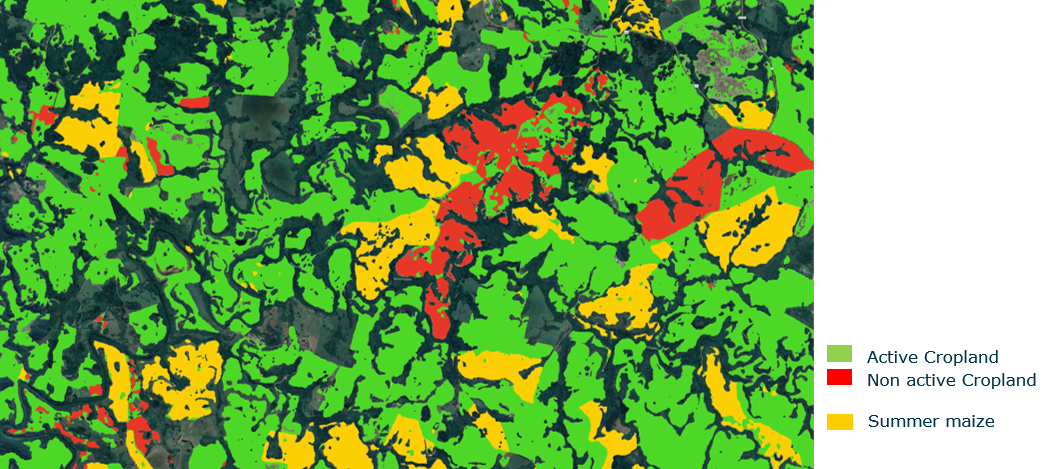
Summer
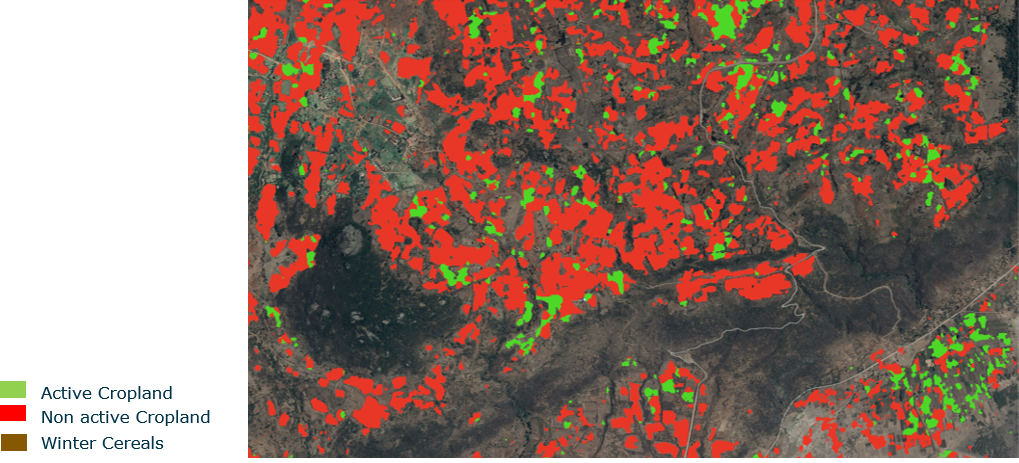
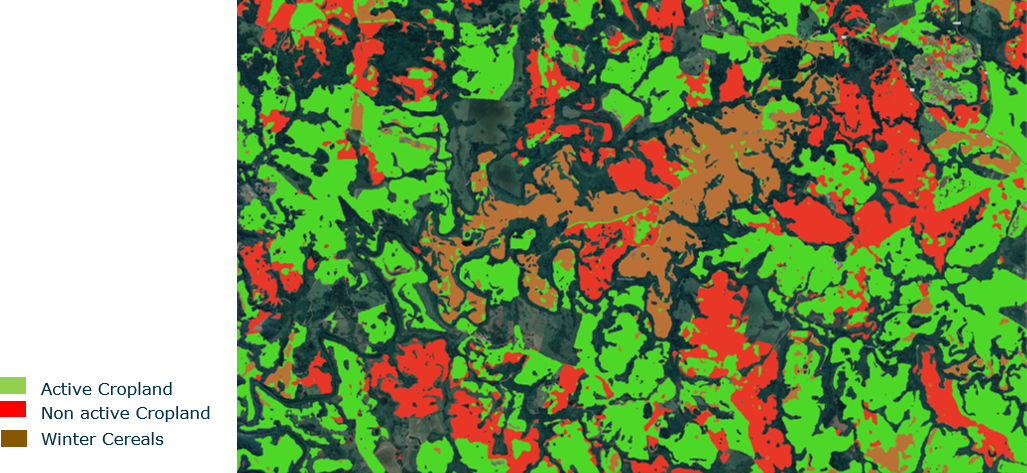
Winter
Not only do satellite data helps us understand the current season’s productivity, but they also provide a rich historical record of agricultural measurements that enable researchers to compare outcomes to previous seasons and evaluate broader trends such as the impacts of climate change. For example, significant parts of Northern Africa and the Middle East are experiencing drought conditions including countries such as Morocco, Tunisia (seen below), Syria and Iraq that are signifincatly impacting crop production. Earth observations are key to identifying and quatifying these impacts early and in providing support for future agricultural planning and mitigation actions when needed.
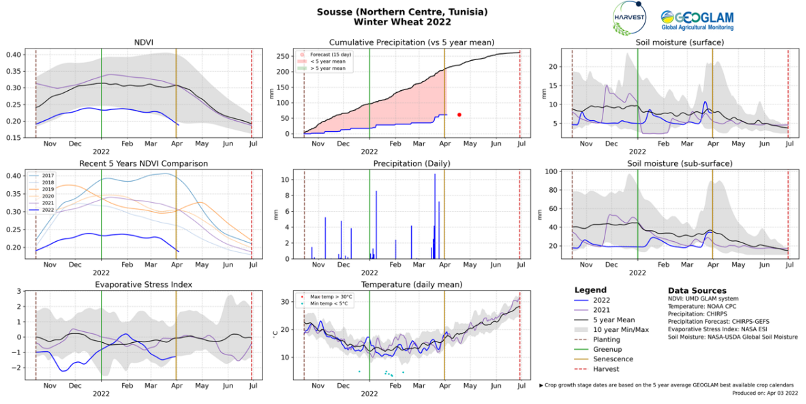
Sousse (Northern Centre, Tunisia) Winter Wheat 2022
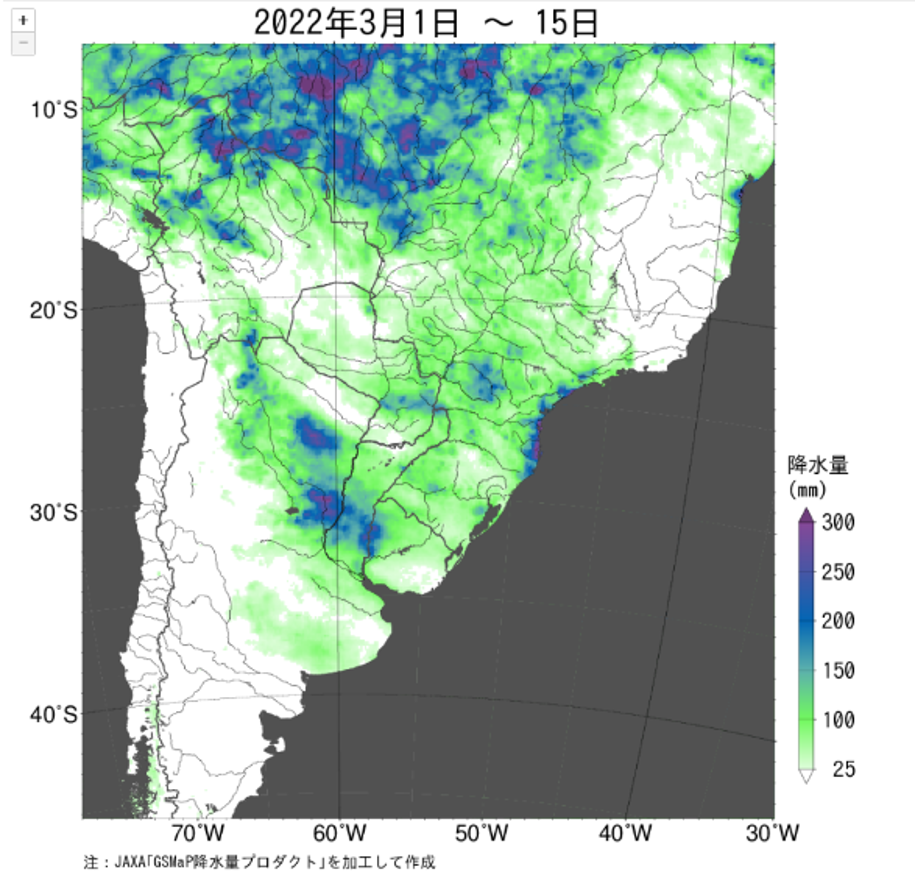
Accumulated and anormal precipitation information derived from GSMaP by JASMIN/JASMAI on this March is shown in following because in Southern Brazil crops did not receive the expected amount of precipitation, which negatively impacted yields of the spring planted crop.
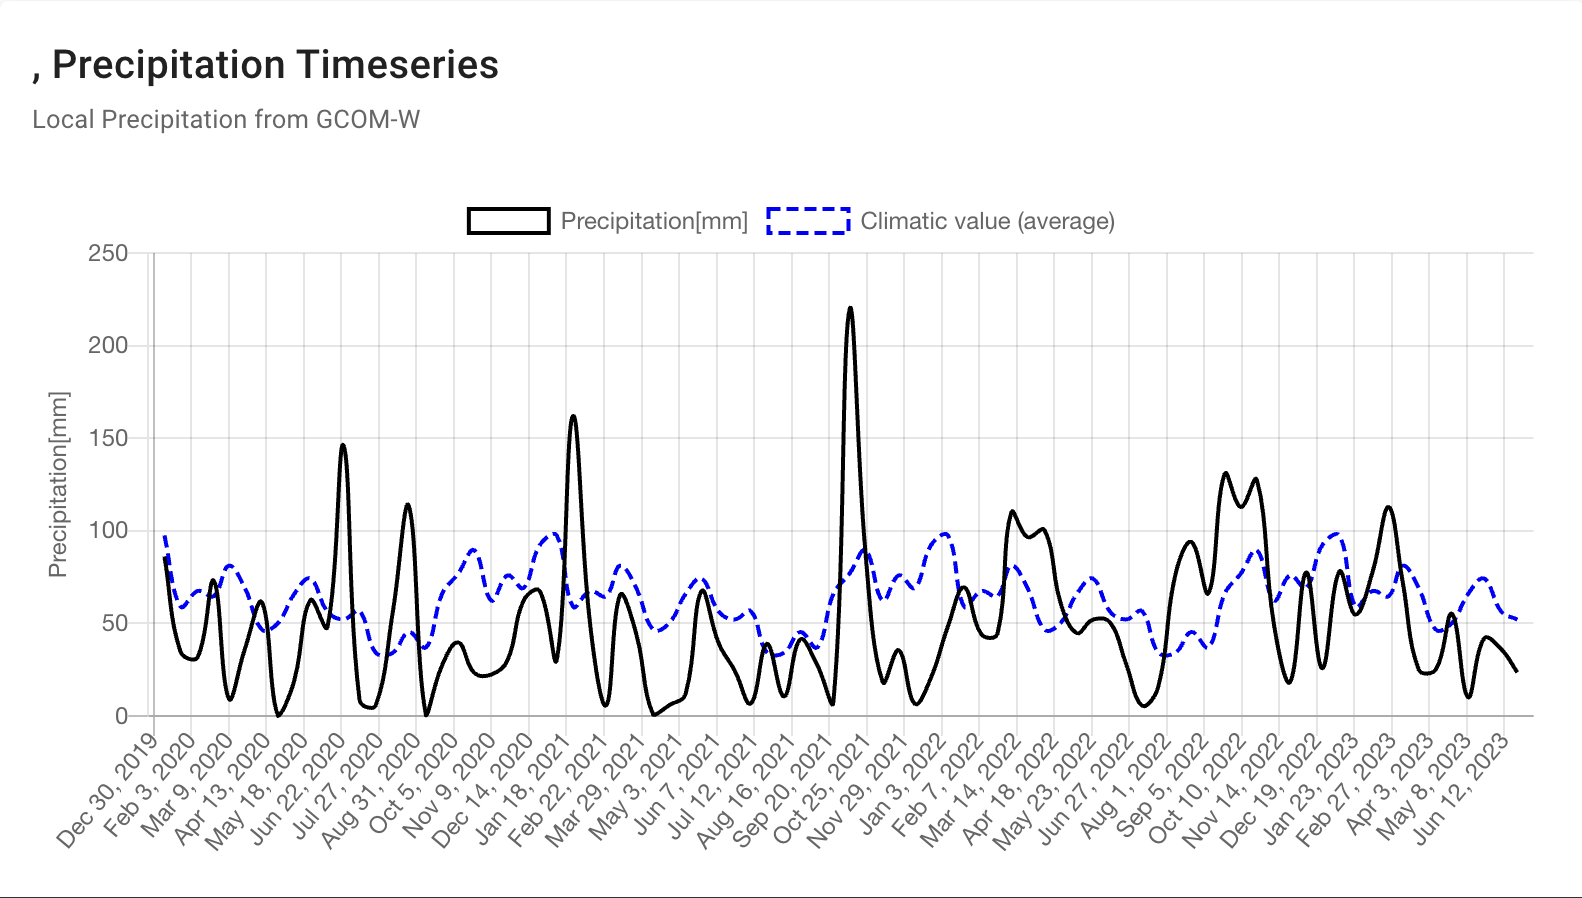
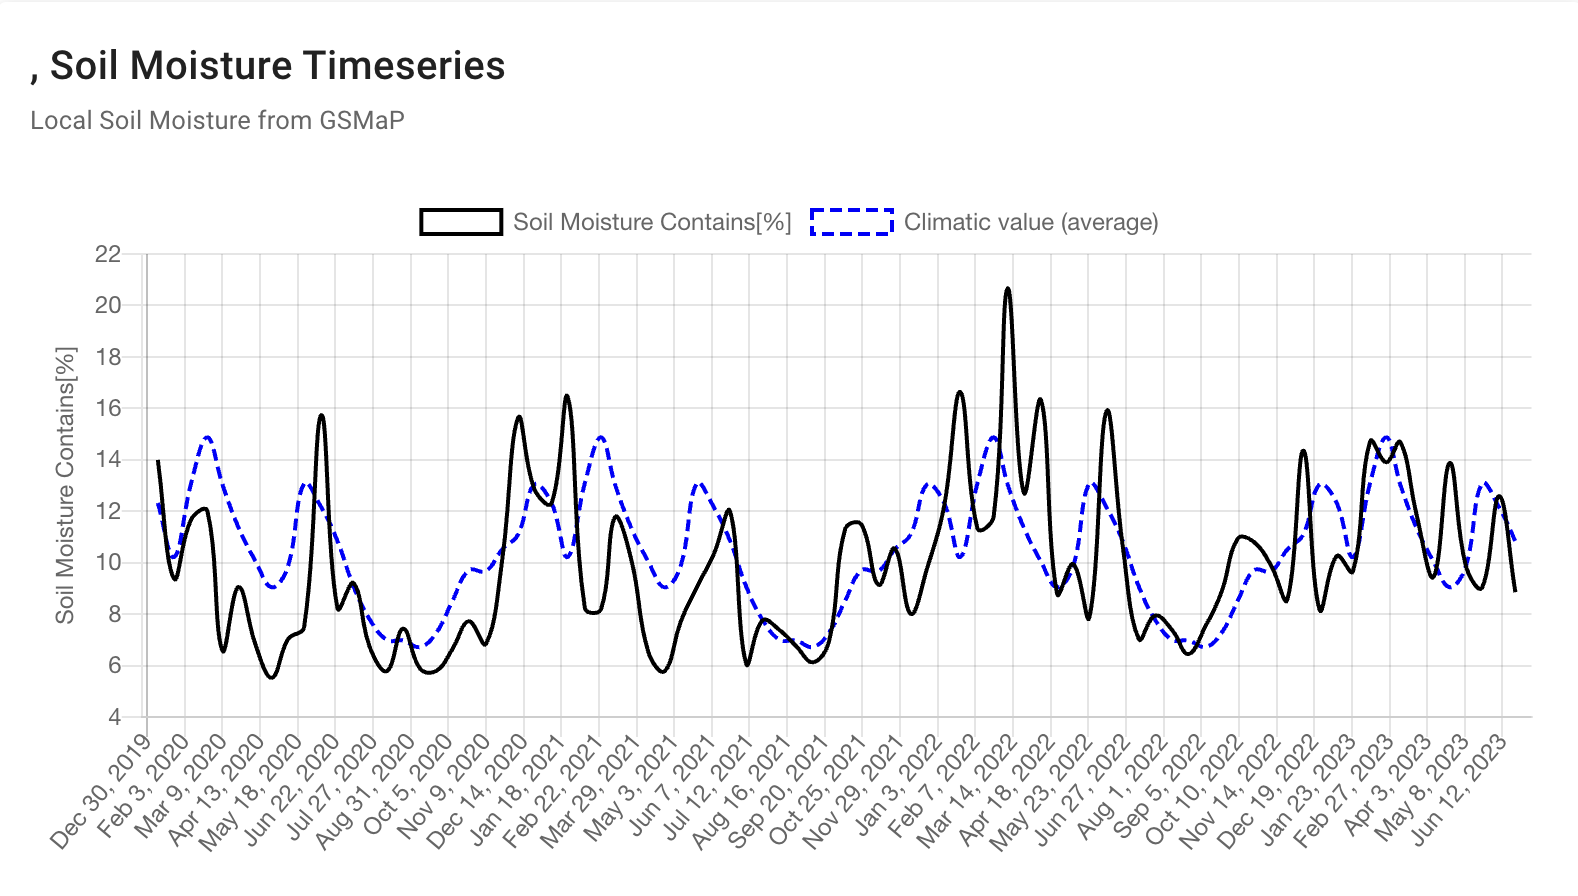
The following time series indicators reflect the precipitation, soil moisture and NDVI variables from JASMIN/JASMAI for Estado de Paraná:
Annual cropland
Summer
** Winter**
As data access and technology have made significant advances in recent decades, it comes as no surprise that the amount of available data can often be overwhelming and difficult to decipher. As such, tools such as the JAXA JASMAI, ESA World Cereal system and the GEOGLAM-Harvest AGMET Indicators play a key role for quick and digestible information processing and supporting key agricultural decisions. In order to increase food market stability and reduce price volatility, it is critical that market analysts, farmers, and other agricultural stakeholders have a thorough understanding of the amount of food coming to market - whether that be in line with the average amount seen in previous years or more/less. Just as with any other consumer good, supply and demand are the key drivers of agrifood markets and commodity prices. Satellite data can fill a critical gap in agricultural monitoring, enabling us to not only understand current crop conditions but prepare for potential outcomes in a given growing season, with wider-reaching impacts on market stability, supporting early action and humanitarian response, and bolstering food security.
| Name | Type | Agency / Provider | Description | Access |
|---|---|---|---|---|
| GEOGLAM Crop Monitor for AMIS | Platform | GEOGLAM / NASA Harvest / ESA / JAXA | International consensus crop condition assessments for wheat, maize, rice, soybean in major producing countries; updated monthly | cropmonitor.org |
| GEOGLAM Crop Monitor on EO Dashboard | Dataset | ESA / NASA / JAXA | Global crop condition raster maps served via VEDA cloud; monthly | eodashboard.org |
| ESA WorldCereal Global Maps | Dataset | ESA / WorldCereal consortium | Seasonally updated global cropland, crop type (maize & wheat), and irrigation maps at 10 m resolution; based on Copernicus Sentinel time series | esa-worldcereal.org |
| GCOM-W / SHIZUKU | Mission / Dataset | JAXA | Passive microwave soil moisture and precipitation; global | JAXA Global |
| NASA SMAP | Mission / Dataset | NASA / JPL | Soil Moisture Active Passive; L-band global soil moisture; daily | smap.jpl.nasa.gov |
| GSMaP - Global Satellite Mapping of Precipitation on EO Dashboard | Dataset | JAXA / EORC | Multi-satellite precipitation analysis; global; used in JASMIN/JASMAI | JAXA EORC |
| EO Dashboard | Platform | ESA / NASA / JAXA | Trilateral open Earth observation dashboard combining satellite data from all three agencies | eodashboard.org |