Replies: 9 comments
-
|
My initial very incomplete suggestions are that: |
Beta Was this translation helpful? Give feedback.
-
@rdstern For me this makes sense. Do you think David or Danny has a strong opinion? |
Beta Was this translation helpful? Give feedback.
-
|
@rdstern I spoke briefly with @dannyparsons and @ChrisMarsh82 this morning. Both were happy with making the log window a tab of the script window. @dannyparsons requested that the log tab has a grey background (and/or other visual clues) to signify that it is read-only and slightly different to the other tabs. He also requested that the button and menu option used to open the log window should remain the same. |
Beta Was this translation helpful? Give feedback.
-
|
@rdstern If we combine the log/script windows, then we have 5 windows - 3 grid windows ('data', 'column metadata' and 'data frame meta data'), and 2 non-grid windows ('output' and 'log/script'). These 5 windows should have consistent help functionality:
What do you think? |
Beta Was this translation helpful? Give feedback.
-
|
@lloyddewit on your points above Now to the windows. This is timely because I weant to also discuss the R-Instat windows in the help file and also have a script. a) There are 7 windows, namely our 5 - as you say - and 2 from R. I suggest we keep the 2 R windows, at least for now. |
Beta Was this translation helpful? Give feedback.
-
|
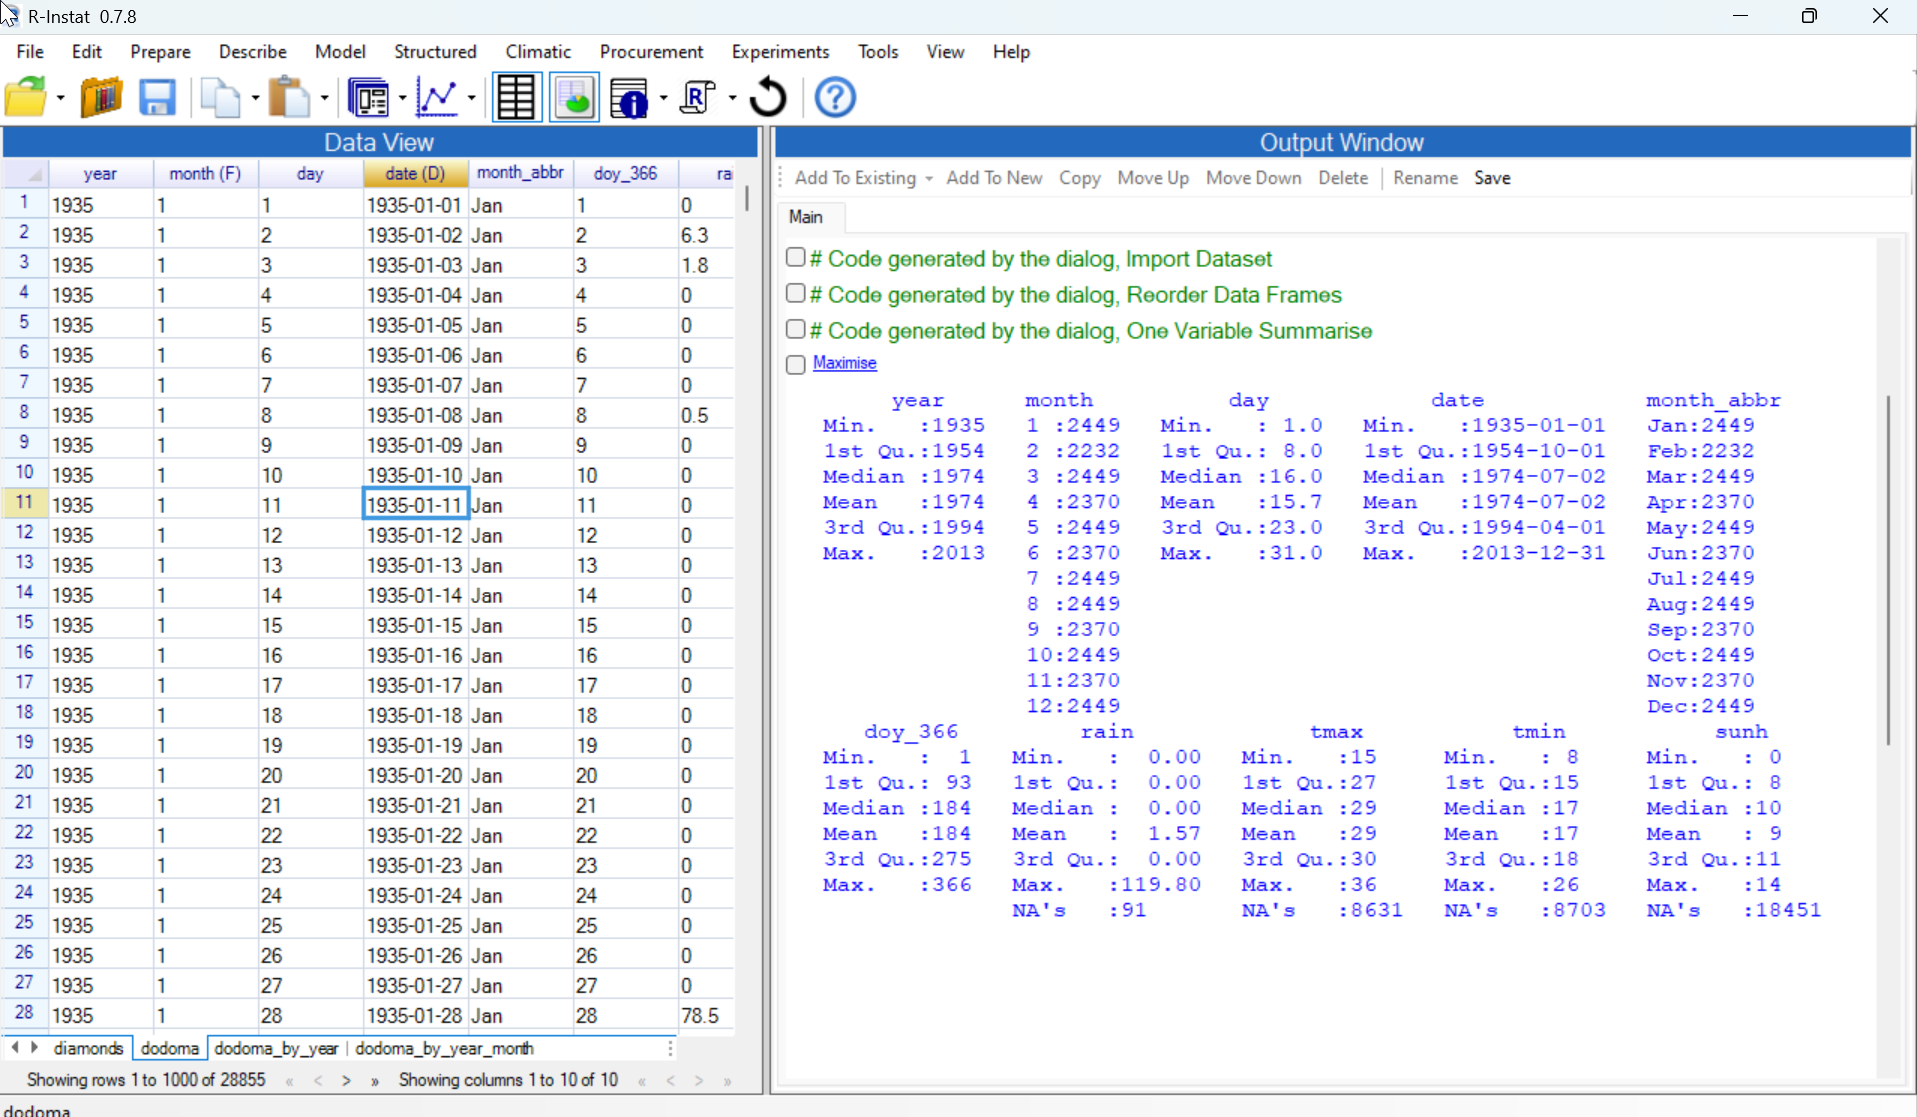
@lloyddewit I continue the windows discussion, because I can't count! There are actually 9 windows in R-Instat! In your 5 you have omitted Patrick's new Maximise window - which still needs improvement. I explain below as a first draft of text, and also a possible video. I hope it is clear and very simple for you - otherwise I need to explain it very differently. The R-Instat windows Here is R-Instat with data from the two tutorials together:
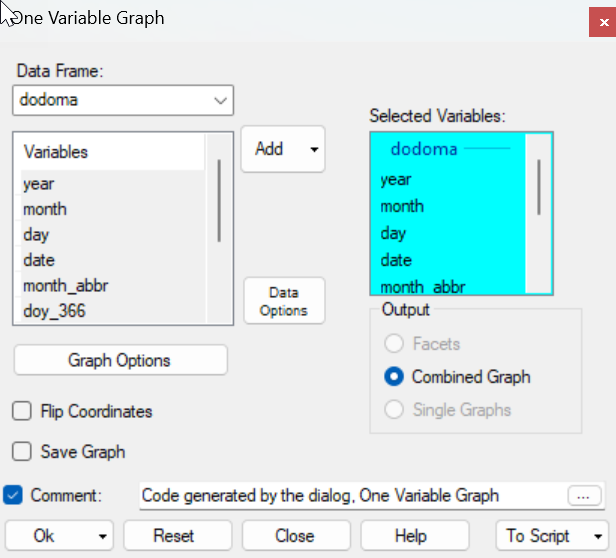
This shows the 2 main windows. On the left is the main data window and the output, or results are in the window on the right. The data window has tabs at the bottom, to move from one data set to another. For larger data sets it is just a window onto part of the data, aand you can use the arrows at the bottom to move from one page to another. The output, or results window also has tabs. All output goes to the main tab, but you can copy important results to additional tabs as you wish. You usually use dialogues with R-Instat and each dialogue gives one way to access two further windows.
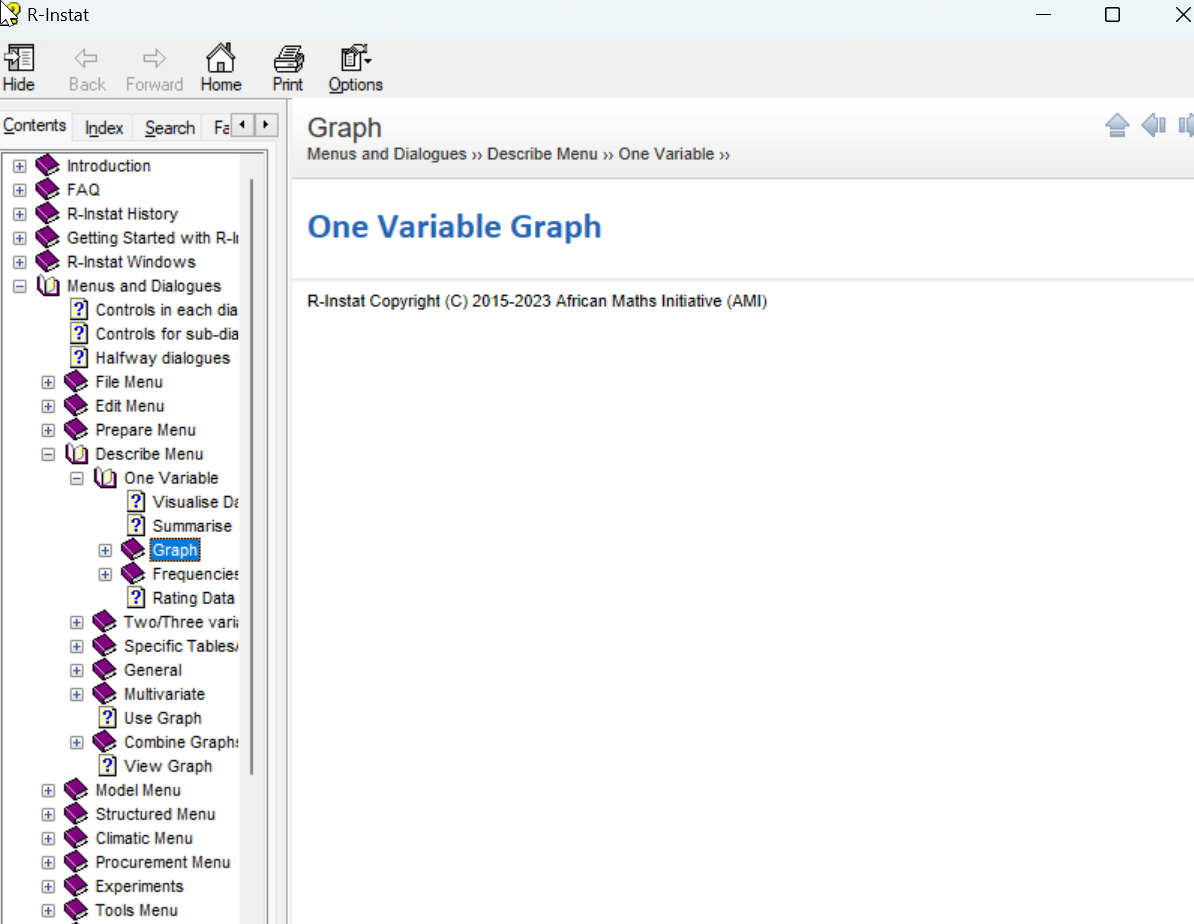
At the bottom is a Help button. Pressing that button opens the
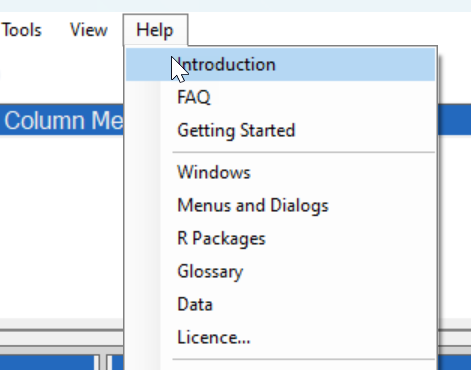
An alternative route to this window is the Help menu.
This allows you to choose your entry point into the Help window. Returning to the dialogue the bottom right button is for more advanced users and is always labelled
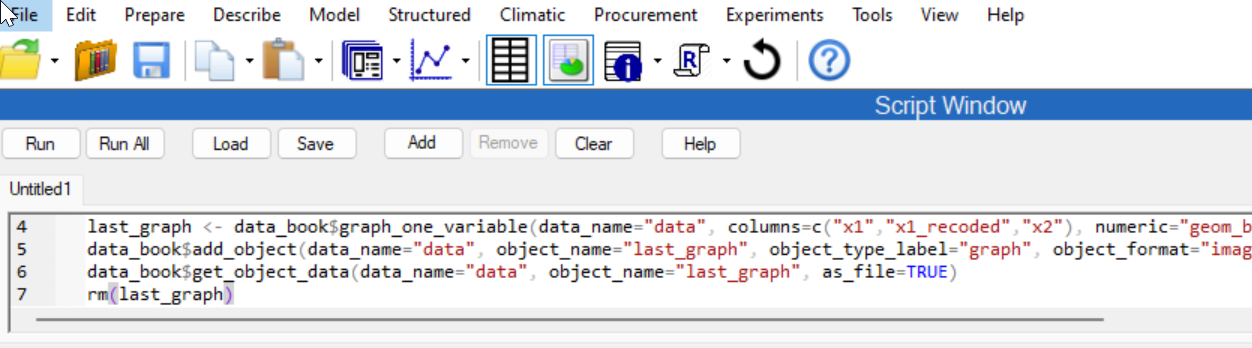
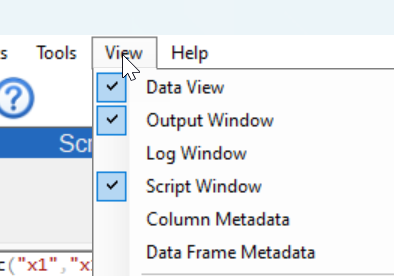
This window also has tabs. One is for the log, which automatically keeps a record of the R commands that have corresponded to your dialogue use of R-Instat. Then you can have one, or more, tabs to examine, edit and try different R scripts. The View menu provides another route to the Log/Script window as follows:
These are the main windows, but there are also 3 more windows to complete your picture of the data, and two more for the outputs. The data first. Start by returning to the default layout - that's via the curly arrow on the toolbar. Or, from the View menu, press to return to the default layout. Then, possibly from the toolbar click on the i icon to get more information about the data. This opens the Column metadata window. as follows: This is another tabbed window that corresponds to the tabs on the data window. For a given data frame, this window has one row for each variable. So, the diamonds data, with 10 variables, has the same 10 rows in this window. It gives the details of each variable. One property of the variables, that isn't used much in R, but we like, is the variable labels. It is often convenient to have reasonably short variable names plus a description. If you ever import survey data from SPSS, or other software, then Add another set to show this - from sjmisc say Then, either from the toolbar, or from the View menu, add the data frame metadata as well. This has one row for each data frame, and includes details of their dimensions. Finally, on the data side, R provides a viewer, if you would like to see all your data together. This is eaither via a right-click on the bottom tab - with the View Data Frame option. Or it is also from the Prepare > Data Frame > View Data dialogue. On the Output, or results, side there is a Maximise button associated with each output. This opens a secondary output window - what do we call it? This is for any results, either numeric or graphical. It is particularly useful for pivot/tables, charts, etc. I need to describe this now. It also provides a home for plotly and enables these outputs, particularly pivot tables to be saved as html. You can have lots of them open, but they each appear as saeparate windows - should they be tabbed!!! An alternative, for graphs, is the R graph viewer. This is resizable - also dangerous - and permits graphs to be saved in various formats. I hope we can add to our maximised window, so we don't need the R graphics window? Is that a reasonable action. |
Beta Was this translation helpful? Give feedback.
-
|
@rdstern I think that all the requests above related to the Log/script window have been implemented. So I removed the |
Beta Was this translation helpful? Give feedback.
-
|
@rdstern The current updated system of Windows is as follows: c) Each right-click menu has a Help option. This goes to a right-click option in the help file in the data window d) The column metadata window has 2 of the same right-click menus (rows and data frame) as the data window, but I have to click the far end on the left along the rows for the menu to appear. The help on clicking it also goes to R packages and commands. The column variable is not clickable in the column metadata
e)The data frame metadata window has the same data frame, right-click menu as the data window, and the column metadata window. It also has the help menu, but when you click it, it takes you to the R packages and commands under Gridextra
f) Right-clicking within the column metadata or data frame metadata window just gives a single Help item (shown in the figure below)
g) The new script windows have a help button that goes to the script window in the help. (I hope we can also consider whether this window can now be combined with the script windows, or it should remain separate?) j) The output window has buttons at the top, with the help option. |


Beta Was this translation helpful? Give feedback.
-
|
@ARMSTRONGOPONDO this is a great review of what is remaining here. I am going to move your remaining actionable points to a new issue. Then I will move this into a discussion to continue the discussions on if the log window and script windows should be combined or separate. Not complete are points: |
Beta Was this translation helpful? Give feedback.
Uh oh!
There was an error while loading. Please reload this page.
Uh oh!
There was an error while loading. Please reload this page.
-
@ChrisMarsh82 and @lloyddewit and @N-thony and @rachelkg Please can we discuss and plan and implement some changes for the March release? We are, at last making progress on the help system, and videos. So I would like plans soon, and carewfully, even if implementation may take considerably longer.
The current system of Windows is as follows:
NOTE THAT THE ACTIONABLE POINTS TO THIS ARE IN ISSUE #9831
Beta Was this translation helpful? Give feedback.
All reactions