Description
Overall, very thorough but not too overwhelming. I appreciate the learning objectives at the outset and I feel that they align well with the content provided. I also appreciate that the code snippets are provided in several languages.
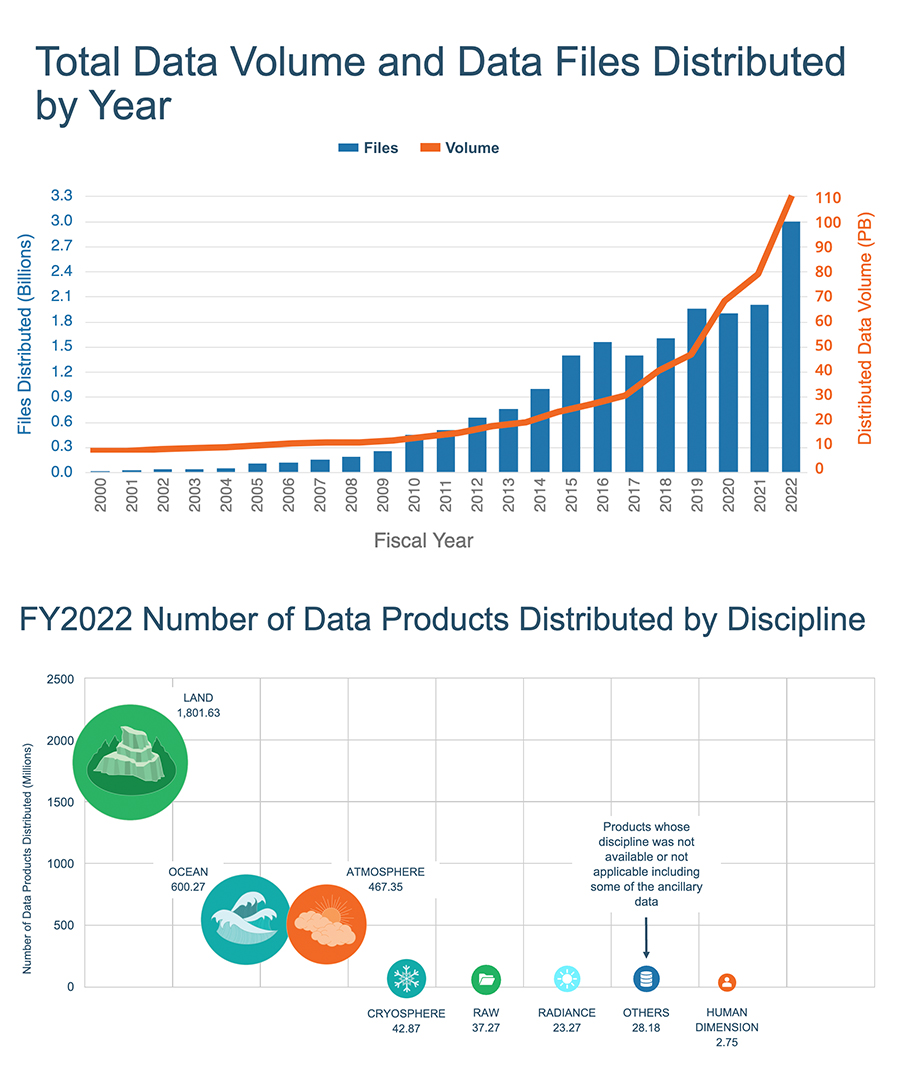
In the Introduction, the authors use a visual to motivate the section and engage students. I really liked this “engagement trigger” approach. Do you think a similar approach could be used to start off all chapters? For this chapter there are many different options for motivating visuals. One example could be a time series of the volume of weather the climate data available (e.g. from the NASA Earth Science and Data Systems: https://www.earthdata.nasa.gov/s3fs-public/2023-01/product-distribution-volume-discipline-2.jpg?VersionId=Tor97BJIz5dyuZofS5swA7RGwdccByVe )? This is just a suggestion.
Another general note about variability. When I have worked with students who are unfamiliar with weather and climate data, they are often surprised at how noisy the data is (even though they experience it everyday!). In the Hands-On Excercise, Step 1 section, it might be useful to ask students to reflect on the components of variability - is there a trend? a clear seasonal cycle? other low and high-frequency variability? This could be done by asking them to plot a time series of a single grid point. This might also lead nicely into the next Chapter where I believe you do touch on this somewhat.
One other general comment: I suggest a note about satellite data products. I have seen products like land surface temperature from MODIS or LANDSAT or NDVI used in some climate econometrics studies, so I think that there should be some mention of these in the Gridded Data section. Perhaps, just a warning that these can be highly uncertain, served on unconventional grids and that collaboration with a climate scientist is recommended. You could also mention that there are some blended satellite+ground-based observational products (e.g. CHIRPS that you mention).
Below are mostly minor comments:
Section 1: Using Weather and Climate Data
- Overall, this section seems a bit too long. I suggest splitting it in two, maybe with the Gridded Data sub-section starting a whole separate section within the chapter. The first section could be something like “Weather and Climate Data Basics” and then the second could be “Using Weather and Climate Data”.
- broken link to Auffhammer et al. (2013)
Sub-section: The NetCDF Data Format - Is there an assumption that students use STATA specifically? This reference to STATA kind of came out of nowhere.
- Python(NetCDF4) link doesn't work - nco -> maybe direct students to use ncdump -h for meta data only rather than ncdump because it is usually way too much of a data dump.
- As an open-source alternative to MATLAB, Python(NetCDF4) + numpy works very well and was typically the way Python users worked before xarray was developed.
Sub-section: NetCDF Contents - it might be helpful to show a schematic of the netcdf data model: https://docs.unidata.ucar.edu/netcdf-c/current/netcdf_data_model.html
Sub-section: NetCDF File Organization - when you list "run" in your terminology bullet list, I don't agree with your statement "Don't worry about this". From a sampling perspective this can be very important - some models have few runs and some have many. Students may over-sample a specific model if they are not aware of what this refers to. Perhaps, you address this later in the tutorial. If so, then I would link to this section, rather than saying "Don't worry about this." Otherwise, I would suggest that this issue of sampling is addressed somewhere in the tutorial.
Sub-section: NetCDF Header - I realize that you want students to do most of the work themselves and not provide them with data sets as examples, but a picture is often worth a thousand words. It would be nice to show the file header - you can use the xarray sample data so that you don't have to rely on external data sources: https://tutorial.xarray.dev/fundamentals/04.1_basic_plotting.html. You could also use this sample data in the plotting section (which I would also recommend).
Sub-section: Attributes - no_sleap -> no_leap
Sub-section: Basic Vis... - the correct title is "An Introduction to Earth and Environmental Data Science"
- Cartopy section link not working
Sub-section: 2-D plotting
- Remember that Earth is a sphere and for most grids you cannot average over all lat/lon points in this way: https://docs.xarray.dev/en/stable/examples/area_weighted_temperature.html
Sub-section: Maps
- Maybe add a note that other projections are available: https://scitools.org.uk/cartopy/docs/v0.15/crs/projections.html
Sub-section: Gridded Data
- General note: it seems that the term “climate data” is being used to refer to “climate model output”. Climate data is not exclusively model output. For example, a 30-year climate normal from a weather station would be considered climate data.
Sub-section: Reanalysis Datasets
- Products also differ by which assimilation scheme is used.
Sub-section: Warning, Station Data
- GHCN link not working
==========================
Section 2: How to start working with a Data Product
- Third link, Reanalysis and Observational Datasets and Variables, is not working
- In first paragraph, I would explicitly say “the NCEP2 reanalysis product” rather than just “NCEP2”, to remind students what type of product this is.
- I would also suggest adding a note about file sizes. It’s sometimes easy to download data without being aware of how much space the files might take up on your computer. For big projects, additional/external storage may be required.
Sub-section: Thinking ahead to climate projections - Auffhammer et al. (2013) link does not seem to be correct
- NASA NEX-GDDP link not working
- GMFD link not working
============================
Section 3: Hands-on Exercise, Step 1
- First paragraph, “(area-weighted, so not usually useful even for studying national-level data) -> not sure what you mean by this. Maybe it will become clear in the “Weighting Schemes” section. If so, perhaps a “see more here” + link to this section would be useful. Otherwise, please elaborate.
- Step 5: “Place the file … in the data/climate_data folder” -> has this folder been introduced already? If not, I suggest rewording: “Create a folder called data/climate_data and place the file in this folder”. Students tend to have a lot of trouble with file paths, so spelling it out is usually helpful.
- I suggest noting the units of the data (deg C) somewhere as the data is not in the usual units of K. It is probably on the BEST website somewhere, but I couldn’t find it easily. It is listed in the temperature variable attributes, but students might not know how to display this.
- File naming convention: CMIP5 -> CMIP6?
- To finish the exercise, I suggest asking students to plot the data and refer them back to the previous code snippets on plotting. Plotting the data is a good way for them to check that the steps they have taken make sense. Maybe asking them to plot a map of the time mean would be a useful exercise.