forked from DataONEorg/collections-portals-schemas
-
Notifications
You must be signed in to change notification settings - Fork 0
/
Copy pathEcoArchives_Jennings-and-Cogan.xml
471 lines (463 loc) · 32.4 KB
/
EcoArchives_Jennings-and-Cogan.xml
1
2
3
4
5
6
7
8
9
10
11
12
13
14
15
16
17
18
19
20
21
22
23
24
25
26
27
28
29
30
31
32
33
34
35
36
37
38
39
40
41
42
43
44
45
46
47
48
49
50
51
52
53
54
55
56
57
58
59
60
61
62
63
64
65
66
67
68
69
70
71
72
73
74
75
76
77
78
79
80
81
82
83
84
85
86
87
88
89
90
91
92
93
94
95
96
97
98
99
100
101
102
103
104
105
106
107
108
109
110
111
112
113
114
115
116
117
118
119
120
121
122
123
124
125
126
127
128
129
130
131
132
133
134
135
136
137
138
139
140
141
142
143
144
145
146
147
148
149
150
151
152
153
154
155
156
157
158
159
160
161
162
163
164
165
166
167
168
169
170
171
172
173
174
175
176
177
178
179
180
181
182
183
184
185
186
187
188
189
190
191
192
193
194
195
196
197
198
199
200
201
202
203
204
205
206
207
208
209
210
211
212
213
214
215
216
217
218
219
220
221
222
223
224
225
226
227
228
229
230
231
232
233
234
235
236
237
238
239
240
241
242
243
244
245
246
247
248
249
250
251
252
253
254
255
256
257
258
259
260
261
262
263
264
265
266
267
268
269
270
271
272
273
274
275
276
277
278
279
280
281
282
283
284
285
286
287
288
289
290
291
292
293
294
295
296
297
298
299
300
301
302
303
304
305
306
307
308
309
310
311
312
313
314
315
316
317
318
319
320
321
322
323
324
325
326
327
328
329
330
331
332
333
334
335
336
337
338
339
340
341
342
343
344
345
346
347
348
349
350
351
352
353
354
355
356
357
358
359
360
361
362
363
364
365
366
367
368
369
370
371
372
373
374
375
376
377
378
379
380
381
382
383
384
385
386
387
388
389
390
391
392
393
394
395
396
397
398
399
400
401
402
403
404
405
406
407
408
409
410
411
412
413
414
415
416
417
418
419
420
421
422
423
424
425
426
427
428
429
430
431
432
433
434
435
436
437
438
439
440
441
442
443
444
445
446
447
448
449
450
451
452
453
454
455
456
457
458
459
460
461
462
463
464
465
466
467
468
469
470
471
<?xml version="1.0" encoding="UTF-8"?>
<eml:eml
xmlns:eml="eml://ecoinformatics.org/eml-2.2.0"
xmlns:stmml="http://www.xml-cml.org/schema/stmml-1.1"
xmlns:xsi="http://www.w3.org/2001/XMLSchema-instance"
xsi:schemaLocation="eml://ecoinformatics.org/eml-2.2.0 /Users/datateam/Desktop/eml.xsd"
packageId="urn:uuid:0000ffff-9999-44aa-8888-888881111eee" system="https://knb.ecoinformatics.org">
<dataset>
<title>Nitrogen and carbon stable isotope variation in northeast Atlantic fishes and squids.</title>
<creator>
<individualName>
<givenName>Simon</givenName>
<surName>Jennings</surName>
</individualName>
<organizationName>Centre for Environment, Fisheries and Aquaculture Science, Lowestoft, Suffolk NR33 0HT United Kingdom</organizationName>
<electronicMailAddress>[email protected]</electronicMailAddress>
</creator>
<creator>
<individualName>
<givenName>Stephanie M.</givenName>
<surName>Cogan</surName>
</individualName>
<organizationName>Centre for Environment, Fisheries and Aquaculture Science, Lowestoft, Suffolk NR33 0HT United Kingdom</organizationName>
</creator>
<pubDate>2015-09-01</pubDate>
<abstract>
<markdown>
Nitrogen and carbon stable isotope data are frequently used to describe the origins and transformations of organic matter. Nitrogen stable isotopes ($\delta^{15}$N) in tissue are used to estimate species’ trophic levels, the extent of omnivory, food chain length, and community-wide relationships between body size and trophic level; the latter leading to estimates of predator–prey mass ratios for parameterization, calibration, and validation of food web models. Carbon stable isotopes ($\delta^{13}$C) are used to identify pathways linking producers and consumers and for studies of migration and movement. Collectively, $\delta^{15}$N and $\delta^{13}$C, often with other stable isotopes such as $\delta^{34}S$, may be used to define the contribution of different producers and pathways to consumer production, to assess the trophic impacts of invasive species and habitat modification, and to predict past habitat use, movements, and migrations. Stable isotope data often complement dietary data (e.g., from stomach contents) in food web studies, because stable isotope composition is indicative of assimilated diet over months to years, depending on species, size, environment, and tissue type. There are relatively few large-scale compilations of $\delta^{15}$N and $\delta^{13}$C data for marine species from offshore habitats, but such data facilitate comparative analysis and research into food web structure and function. The data provided comprise 5535 records for individuals of 62 species of fish and squid weighing 0.3 g to 17920 g and sampled from the northeast Atlantic shelf seas (Celtic Sea, North Sea, Irish Sea, Channel) from 2002 to 2010. For every sampled individual the record lists: species name, date of sampling, position of sampling, body mass, percentage nitrogen in muscle tissue, percentage carbon in muscle tissue, and $\delta^{15}$N and $\delta^{13}$C natural abundance in muscle tissue. Awareness of, and access to, these data should catalyze and facilitate new research with stable isotopes, to improve understanding of marine biology, food web ecology, and human impacts on the environment.
</markdown>
</abstract>
<keywordSet>
<keyword>body size</keyword>
<keyword>cephalopod</keyword>
<keyword>consumer</keyword>
<keyword>elasmobranch</keyword>
<keyword>food chain</keyword>
<keyword>food web</keyword>
<keyword>marine</keyword>
<keyword>producer</keyword>
<keyword>teleost</keyword>
<keyword>trophic position</keyword>
<keyword>stable isotopes</keyword>
<keywordThesaurus>None</keywordThesaurus>
</keywordSet>
<licensed>
<licenseName>Creative Commons Attribution 4.0 International</licenseName>
<url>https://spdx.org/licenses/CC-BY-4.0.html</url>
<identifier>CC-BY-4.0</identifier>
</licensed>
<coverage>
<geographicCoverage>
<geographicDescription>Northern North Sea</geographicDescription>
<boundingCoordinates>
<westBoundingCoordinate>-1</westBoundingCoordinate>
<eastBoundingCoordinate>4</eastBoundingCoordinate>
<northBoundingCoordinate>61.5</northBoundingCoordinate>
<southBoundingCoordinate>57.5</southBoundingCoordinate>
</boundingCoordinates>
</geographicCoverage>
<temporalCoverage>
<rangeOfDates>
<beginDate>
<calendarDate>2002</calendarDate>
</beginDate>
<endDate>
<calendarDate>2006</calendarDate>
</endDate>
</rangeOfDates>
</temporalCoverage>
</coverage>
<purpose>
<markdown>
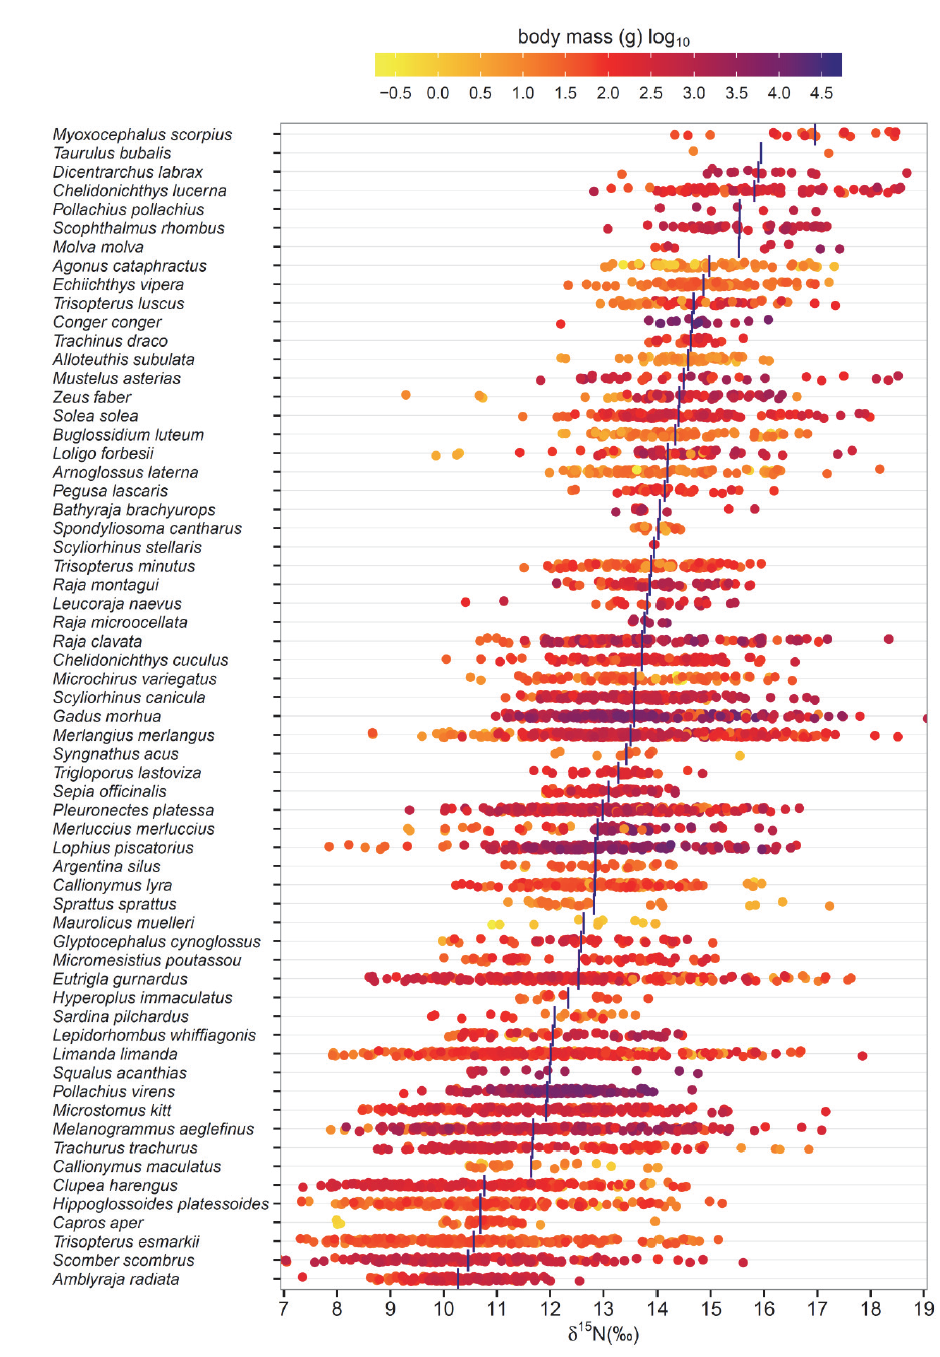
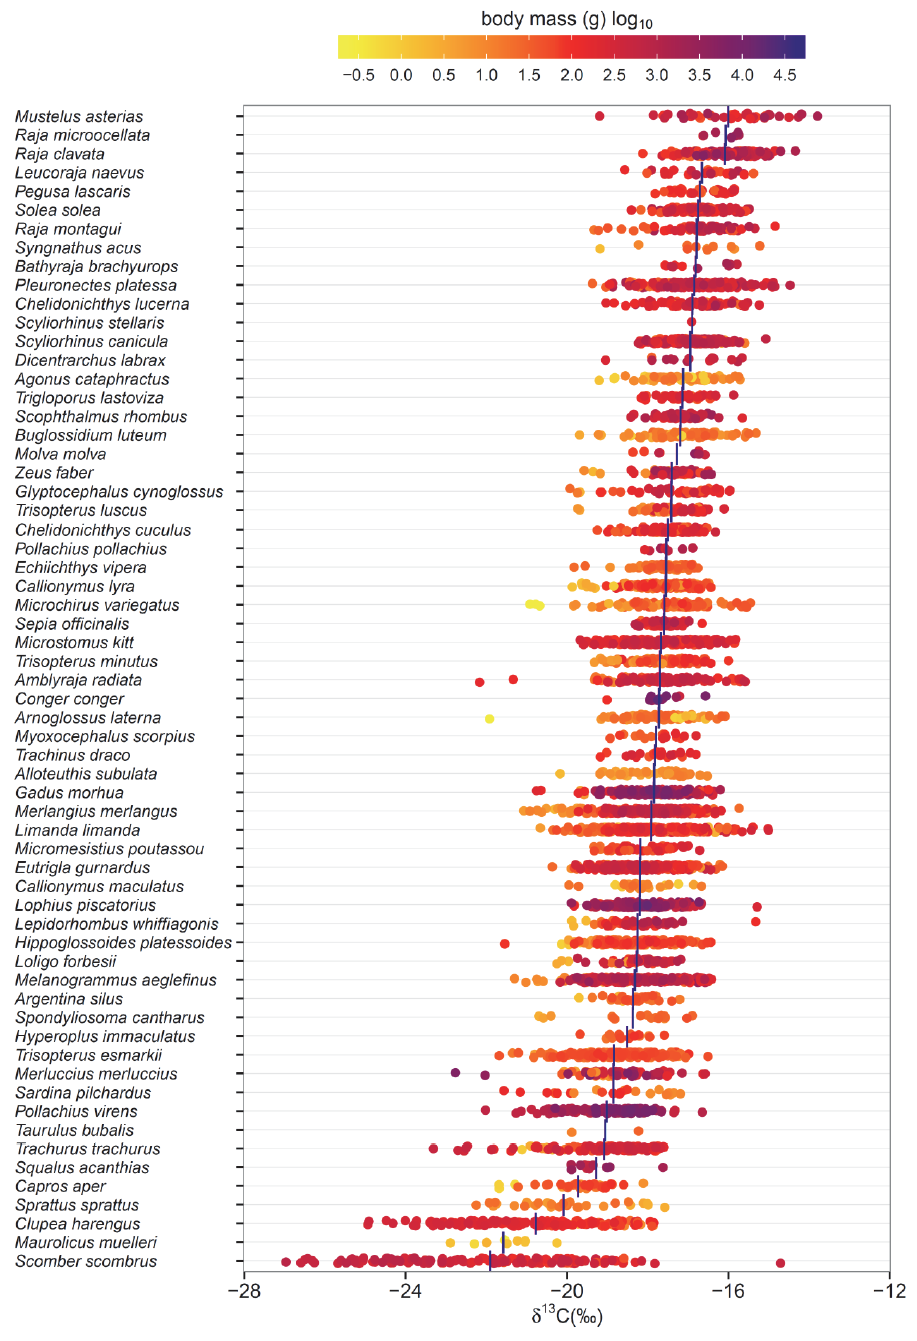
The objective of the project is to improve knowledge of marine food webs; to support development of models of human and environmental impacts. The dataset includes 5535 records of $\delta{15}$N and $\delta^{13}$C natural abundance for individual marine fishes and squids from the Celtic Sea, Channel, Irish Sea and North Sea in the northeast Atlantic. Data were collected from 2002 to 2010. Individuals from each species in each region were sampled to span the range of body sizes present. For species with juvenile stages living offshore the sampling included juveniles. For species with juvenile stages using estuaries and coastal habitats it did not. The range of species and body sizes included in the dataset and the associated $\delta{15}$N and $\delta^{13}$C estimates for muscle tissue are summarized in Figs. 1 and 2.
</markdown>
</purpose>
<acknowledgements>
We thank the U.K. Department of Environment, Food and Rural Affairs for their longstanding support of this research; the many scientists who assisted with at sea sampling, especially Richard Ayers, Mary Brown, Jim Ellis, Freya Goodsir, Sophie McCully and Brian Harley; Peter Davison, Roger Hillier and Jon Santillo for processing samples and Iso-Analytical for conducting the stable isotope analyses. We thank two anonymous referees for their thorough reviews of this data paper.
</acknowledgements>
<contact>
<individualName>
<givenName>Simon</givenName>
<surName>Jennings</surName>
</individualName>
<organizationName>Centre for Environment, Fisheries and Aquaculture Science, Lowestoft, Suffolk NR33 0HT United Kingdom</organizationName>
<electronicMailAddress>[email protected]</electronicMailAddress>
</contact>
<methods>
<methodStep>
<description>
<section>
<title>Data acquisition</title>
<markdown>
In the northern North Sea fishes were caught at 21 stations in an area from 57.5° N - 61.5° N and 1° W - 4° E The stations were fished every year from 2002 to 2006 with a Grande Ouverture Verticale (GOV) bottom fished otter trawl net fitted with a 20-mm cod-end liner and towed for approximately 30 minutes at approximately 4 knots. The area was sampled in August and/ or September during the North Sea English Bottom Trawl Survey (2002: 25 Aug to 4 Sept; 2003: 22 Aug to 2 Sept; 2004: 22 Aug to 30 Aug; 2005: 16 Sept to 22 Sept; 2006: 25 Aug to 8 Sept). In the data set, all fishing positions are assigned to the latitude and longitude at the center of the sampled area and to the midpoint date of the sampling period in each year.
For each of 15 fish species shown to have the highest rank biomass in North Sea English Bottom Trawl Survey data from the sampling area in 2000 and 2001, the sampling aim for each of the years 2002 to 2006 was to collect up to 4 individuals from each of 10–13 length classes spanning the range of total body lengths caught in 2000 and 2001. Length class intervals ranged from 1 cm for the smallest species to 7 cm for the largest. The total weight of each individual assigned to a length class was recorded to the nearest 0.1 g wet mass (after “blotting” to remove surface water), or to 1g for larger fishes (typically >1 kg). One to five cm3 of white muscle tissue was dissected from the dorsal musculature of each individual and immediately frozen to < –20°C and stored frozen until the next step of processing (freeze drying), a procedure that has no effect on the nitrogen stable isotope composition of fish tissue [@Sweeting_et_al_2004].
In areas other than the northern North Sea (south and central North Sea, Channel, Irish Sea, and Celtic Sea) fishes and squids were caught with GOV otter trawl or 4-m beam trawl in 2010. The GOV and 4 m beam trawls were towed for approximately 30 minutes at a speed of approximately 4 knots. For these data, all positions were assigned to the latitude and longitude where the net was shot.
The sampling aim for 2010 was to catch up to six individuals from each of 7 to 12 length classes spanning body length ranges of fishes and squid recorded in previous surveys in each sea area (south and central North Sea, Channel (stratified by 4 sub-areas), Irish Sea (3 sub-areas) and Celtic Sea (2 subareas)). Classes ranged from 2 cm for the smallest species to 10 cm for the largest. The total weight of each individual assigned to a length class was recorded to the nearest 0.1 g wet blotted weight for smaller fishes, or to 1g for most fishes >1 kg. Up to two cm$^3$ of white muscle tissue was dissected from the dorsal musculature of each individual fish, or from the mantle for each individual squid, and immediately frozen and then stored at –20°C until it could be freeze-dried.
In the laboratory, frozen fish and squid tissue was freeze dried to constant mass and ground with pestle and mortar to fine homogeneous powder. All equipment was cleaned after processing each individual sample and the powdered material was transferred to a new glass vial. The nitrogen and carbon stable isotopic composition of the powdered samples was determined using a Europa Scientific 20-20 IRMS with a Europa Scientific Roboprep-CN preparation module by Iso-Analytical Ltd (Crewe, UK). Two reference samples were analysed after every four to six samples of fish tissue. The reference materials used during analysis of all samples were Iso-Analytical Standards IA-R014 (powdered bovine liver), IA-R005 (beet sugar) and IA-R045 and IA-R046 (ammonium sulphate) (see B. Quality assurance/ quality control procedures). Twenty percent of fish and squid samples were processed in duplicate for quality control. The $^{15}$N and $^{13}$C composition of tissue samples was expressed in conventional delta notation ($\delta^{15}$N and $\delta^{13}$C), relative to the abundance of $^{15}$N in atmospheric N$_2$ and $^{13}$C in Pee Dee Belemnite. Experimental precision, measured as the standard deviation in $\delta^{15}$N or $\delta^{13}$C for replicates of reference material, was < 0.1‰ for both isotopes in all batches of samples. Within batches of samples, the standard deviation of the distribution of differences in $\delta^{15}$N or $\delta^{13}$C between the two samples in each duplicated pair tended to be slightly higher than the standard deviation of $\delta^{15}$N or $\delta^{13}$C for replicates of reference material (< 0.25‰ for either isotope in any batch), but the 95th percentile of the overall distribution of absolute differences in $\delta^{15}$N or $\delta^{13}$C between the two samples in each duplicated pair (i.e., for all 1107 samples processed in duplicate) was 0.17‰ for $\delta^{15}$N and 0.21 for $\delta^{13}$C.
$^{13}$C analysis was conducted without lipid extraction. Previous work has shown that $\delta^{13}$C data for fish can be corrected for differences lipid content using C:N ratio data [@Fry_et_al_2003] and that the results are consistent with those obtained for fish tissue following chemical lipid extraction [@Sweeting_et_al_2006]. The $\delta^{13}$C data included in the published data set are not corrected for differences in lipid content, but the percentage C and N data that are included can be used to make the correction if required. @Logan_et_al_2008 provide further information on methods of lipid correction and their performance.
</markdown>
</section>
</description>
</methodStep>
<methodStep>
<description>
<section>
<title>Quality assurance/quality control procedures</title>
<markdown>
All documentation, tracking of samples and entry of data was independently reviewed by at least one other scientist and all projects supporting the collection and processing of samples followed the Joint Code of Practice for Research (JCoPR) of the U.K. Department of Environment, Food and Rural Affairs and the U.K. Research Councils. Independent review involved line by line checking of the reference code used to track the sample from capture through processing and isotope analysis against (1) the record of species identity, size and capture location from the cruise, (2) the record of labelling and processing and (3) the record that included the results of the stable isotope data. The standards used by Iso-Analytical are calibrated against and traceable to inter-laboratory comparison standards distributed by the International Atomic Energy Agency (IAEA). IA-R042 (which comprises a mixture of IA-R005 and IA-R045) is calibrated against and traceable to IAEA-CH-6 and IAEA-N-1. IA-R005 is calibrated against and traceable to IAEA-CH-6. IA-R045 and IA-R046 are calibrated against and traceable to IAEA-N-1.
</markdown>
</section>
</description>
</methodStep>
<methodStep>
<description>
<section>
<title>Archiving</title>
<markdown>
The data file and the results of individual analyses with associated Quality Assurance and Quality Control data are stored on the network at the Centre for Environment, Fisheries and Aquaculture Science, Lowestoft, United Kingdom.
</markdown>
</section>
</description>
</methodStep>
</methods>
<project>
<title>Marine food webs</title>
<personnel>
<individualName>
<givenName>Simon</givenName>
<surName>Jennings</surName>
</individualName>
<organizationName>Centre for Environment, Fisheries and Aquaculture Science, Lowestoft, Suffolk, NR33 0HT, UK</organizationName>
<role>Originator</role>
</personnel>
<award>
<funderName>U.K. Department for Environment, Food and Rural Affairs</funderName>
<funderIdentifier>https://dx.doi.org/10.13039/501100000277</funderIdentifier>
<awardNumber>MF0731</awardNumber>
<title>Development and testing of ecological indicators and models to monitor and predict the ecosystem effects of fishing</title>
</award>
<award>
<funderName>U.K. Department for Environment, Food and Rural Affairs</funderName>
<funderIdentifier>https://dx.doi.org/10.13039/501100000277</funderIdentifier>
<awardNumber>MF1001</awardNumber>
<title>Ecosystem approach to fisheries</title>
</award>
<award>
<funderName>U.K. Department for Environment, Food and Rural Affairs</funderName>
<funderIdentifier>https://dx.doi.org/10.13039/501100000277</funderIdentifier>
<awardNumber>MF1225</awardNumber>
<title>Developing the evidence base to support the integration of fisheries and environmental management</title>
</award>
</project>
<dataTable>
<entityName>SIA_N_C_Atlantic_marine_fishes_squids_20150105_v1.csv</entityName>
<physical scope="document">
<objectName>SIA_N_C_Atlantic_marine_fishes_squids_20150105_v1.csv</objectName>
<size unit="bytes">454000</size>
<authentication method="SHA1">140be52c18d112c7e06adb2751f2a6effd622a98</authentication>
<dataFormat>
<externallyDefinedFormat>
<formatName>text/csv</formatName>
</externallyDefinedFormat>
</dataFormat>
<distribution scope="document">
<online>
<url function="download">http://esapubs.org/archive/ecol/E096/226/SIA_N_C_Atlantic_marine_fishes_squids_20150105_v1.csv</url>
</online>
</distribution>
</physical>
<attributeList>
<attribute>
<attributeName>record</attributeName>
<attributeDefinition>Record number</attributeDefinition>
<measurementScale>
<nominal>
<nonNumericDomain>
<textDomain>
<definition>Record number</definition>
</textDomain>
</nonNumericDomain>
</nominal>
</measurementScale>
</attribute>
<attribute>
<attributeName>species</attributeName>
<attributeDefinition>Latin binomial species name (see Table 2 for list of species and taxonomic classification)</attributeDefinition>
<measurementScale>
<nominal>
<nonNumericDomain>
<textDomain>
<definition>Latin binomial species name</definition>
</textDomain>
</nonNumericDomain>
</nominal>
</measurementScale>
</attribute>
<attribute>
<attributeName>year</attributeName>
<attributeDefinition>Year of sampling</attributeDefinition>
<measurementScale>
<dateTime>
<formatString>YYYY</formatString>
</dateTime>
</measurementScale>
</attribute>
<attribute>
<attributeName>DOY</attributeName>
<attributeDefinition>Day of year of sampling (from 1 January = DOY 1) in year of sampling</attributeDefinition>
<<measurementScale>
<ratio>
<unit>
<standardUnit>nominalDay</standardUnit>
</unit>
<numericDomain>
<numberType>whole</numberType>
</numericDomain>
</ratio>
</measurementScale>
</attribute>
<attribute>
<attributeName>latitude</attributeName>
<attributeDefinition>Latitude at sampling position (N)</attributeDefinition>
<measurementScale>
<ratio>
<unit>
<standardUnit>degree</standardUnit>
</unit>
<numericDomain>
<numberType>real</numberType>
</numericDomain>
</ratio>
</measurementScale>
</attribute>
<attribute>
<attributeName>longitude</attributeName>
<attributeDefinition>Longitude at sampling position (E, positive values; W, negative values)</attributeDefinition>
<measurementScale>
<ratio>
<unit>
<standardUnit>degree</standardUnit>
</unit>
<numericDomain>
<numberType>real</numberType>
</numericDomain>
</ratio>
</measurementScale>
</attribute>
<attribute>
<attributeName>sea</attributeName>
<attributeDefinition>Sea area that includes sampling position</attributeDefinition>
<measurementScale>
<nominal>
<nonNumericDomain>
<textDomain>
<definition>Sea area that includes sampling position</definition>
</textDomain>
</nonNumericDomain>
</nominal>
</measurementScale>
</attribute>
<attribute>
<attributeName>mass</attributeName>
<attributeDefinition>Total wet mass of sampled individual</attributeDefinition>
<measurementScale>
<ratio>
<unit>
<standardUnit>g</standardUnit>
</unit>
<numericDomain>
<numberType>real</numberType>
</numericDomain>
</ratio>
</measurementScale>
</attribute>
<attribute>
<attributeName>Nperc</attributeName>
<attributeDefinition>Percentage nitrogen by mass in dried muscle tissue</attributeDefinition>
<measurementScale>
<ratio>
<unit>
<standardUnit>dimensionless</standardUnit>
</unit>
<numericDomain>
<numberType>real</numberType>
</numericDomain>
</ratio>
</measurementScale>
</attribute>
<attribute>
<attributeName>Cperc</attributeName>
<attributeDefinition>Percentage carbon by mass in dried muscle tissue</attributeDefinition>
<measurementScale>
<ratio>
<unit>
<standardUnit>dimensionless</standardUnit>
</unit>
<numericDomain>
<numberType>real</numberType>
</numericDomain>
</ratio>
</measurementScale>
</attribute>
<attribute>
<attributeName>d15N</attributeName>
<attributeDefinition>Nitrogen stable isotope content of muscle tissue as $\delta^{15}$N</attributeDefinition>
<measurementScale>
<ratio>
<unit>
<standardUnit>dimensionless</standardUnit>
</unit>
<numericDomain>
<numberType>real</numberType>
</numericDomain>
</ratio>
</measurementScale>
</attribute>
<attribute>
<attributeName>d13C</attributeName>
<attributeDefinition>Carbon stable isotope content of muscle tissue as $\delta^{13}$C</attributeDefinition>
<measurementScale>
<ratio>
<unit>
<standardUnit>dimensionless</standardUnit>
</unit>
<numericDomain>
<numberType>real</numberType>
</numericDomain>
</ratio>
</measurementScale>
</attribute>
</attributeList>
</dataTable>
<otherEntity id="urn:uuid:0000000f-00c-4d00-b00c-100000000a2e" scope="document">
<entityName>Fig1.png</entityName>
<entityDescription>Summary of the ranges of species and body sizes for which δ15N data are available. Data presented are for all sampling years and areas combined. Vertical blue bars indicate mean δ15N by species. Points are ‘jittered’ (i.e., offset) to increase visibility.</entityDescription>
<physical scope="document">
<objectName>Fig1.png</objectName>
<size unit="bytes">18074</size>
<authentication method="SHA1">fe5648e21a068409c1bf10ceae29ee2aacf0fdf9</authentication>
<dataFormat>
<externallyDefinedFormat>
<formatName>image/png</formatName>
</externallyDefinedFormat>
</dataFormat>
<distribution scope="document">
<online>
<url function="download">http://esapubs.org/archive/ecol/E096/226/Fig1.png</url>
</online>
</distribution>
</physical>
<entityType>Other</entityType>
</otherEntity>
<otherEntity id="urn:uuid:00cd0000-0000-0f00-00ea-3d00000cb1bb" scope="document">
<entityName>Fig2.png</entityName>
<entityDescription>Summary of the ranges of species and body sizes for which δ13C data are available. Data presented are for all sampling years and areas combined. Vertical blue bars indicate mean δ13N by species. Points are ‘jittered’ to increase visibility.</entityDescription>
<physical scope="document">
<objectName>Fig2.png</objectName>
<size unit="bytes">99825</size>
<authentication method="SHA1">88526341ead34b737b4c1fcf07bbe17a3fb82412</authentication>
<dataFormat>
<externallyDefinedFormat>
<formatName>image/png</formatName>
</externallyDefinedFormat>
</dataFormat>
<distribution scope="document">
<online>
<url function="download">http://esapubs.org/archive/ecol/E096/226/Fig2.png</url>
</online>
</distribution>
</physical>
<entityType>Other</entityType>
</otherEntity>
<referencePublication>
<bibtex>
@article{Jennings_et_al_2008a,
author = {S Jennings and C Barnes and NVC Polunin},
title = {Application of nitrogen stable isotope analysis in size-based marine food web and macroecological research},
journal = {Rapid Communications in Mass Spectrometry},
volume = {22},
year = {2006},
pages = {1673--1680},
url = {https://doi.org/10.1002/rcm.3497}
doi = {10.1002/rcm.3497}
}
@article{Jennings_et_al_2007,
author = {S Jennings and JAA D'Oliveira and KJ Warr},
title = {Measurement of body size and abundance in tests of macroecological and food web theory},
journal = {Journal of Animal Ecology},
volume = {76},
year = {2007},
pages = {72--82},
url = {https://doi.org/10.1111/j.1365-2656.2006.01180.x}
doi = {10.1111/j.1365-2656.2006.01180.x}
}
@article{Jennings_et_al_2008b,
author = {S Jennings and TD Maxwell and M Schratzberger and SP Milligan},
title = {Body-size dependent temporal variations in nitrogen stable isotope ratios in food webs},
journal = {Marine Ecology Progress Series},
volume = {370},
year = {2008},
pages = {199--206},
url = {http://www.jstor.org/stable/24872671}
}
@article{Jennings_et_al_2008c,
author = {S Jennings and R Van Hal and JG Hiddink and TAD Maxwell},
title = {Fishing effects on energy use by North Sea fishes},
journal = {Journal of Sea Research},
volume = {60},
year = {2008},
pages = {74--88},
url = {https://doi.org/10.1016/j.seares.2008.02.007}
doi = {10.1016/j.seares.2008.02.007}
}
</bibtex>
</referencePublication>
<literatureCited>
<bibtex>
@article{Fry_et_al_2003,
author = {B Fry and DM Baltz and MC Benfield and JW Fleeger and A Gaceand HL Haas and ZJ Qui{\~n}ones-Rivera},
title = {Stable isotope indicators of movement and residency for brown shrimp (\textit{Farfantepenaeus aztecus}) in coastal Louisiana marshscapes},
journal = {Estuaries},
volume = {26},
year = {2003},
pages = {82--97},
url = {https://doi.org/10.1007/BF02691696},
doi = {10.1007/BF02691696}
}
@article{Logan_et_al_2008,
author = {JM Logan and TD Jardine and TJ Miller and SE Bunn and RA Cunjak and ME Lutcavage},
title = {Lipid corrections in carbon and nitrogen stable isotope analyses: comparison of chemical extraction and modelling methods},
journal = {Journal of Animal Ecology},
volume = {77},
year = {2008},
pages = {838--846},
url = {https://doi.org/10.1111/j.1365-2656.2008.01394.x},
doi = {10.1111/j.1365-2656.2008.01394.x}
}
@article{Sweeting_et_al_2004,
author = {CJ Sweeting and NVC Polunin and S Jennings},
title = {Tissue and fixative dependent shifts of $\delta^{13}$C and $\delta^{15}$N in preserved ecological material},
journal = {Rapid Communications in Mass Spectrometry},
volume = {18},
year = {2004},
pages = {2587--2592},
url = {https://doi.org/10.1002/rcm.1661},
doi = {10.1002/rcm.1661}
}
@article{Sweeting_et_al_2006,
author = {CJ Sweeting and NVC Polunin and S Jennings},
title = {Effects of chemical lipid extraction and arithmetic lipid correction on stable isotope ratios of fish tissues},
journal = {Rapid Communications in Mass Spectrometry},
volume = {20},
year = {2006},
pages = {595--601},
url = {https://doi.org/10.1002/rcm.2347},
doi = {10.1002/rcm.2347}
}
</bibtex>
</literatureCited>
</dataset>
</eml:eml>