How to use seen.txt and updated.txt to generate graphs for comparison #22
Comments
|
Yes we are all having the same issue. There appears to be something odd happening with scala 2.11. If you upgarade all of the versions in the pom.xml, not just the shell script, and run If you want to try and play around with upgrading the version of flink to 1.x and along with it hopefully the kafka version. Then look at the spark side as well that would be great. In the mean time I suggest you try to find/build the older releases of flink and spark then place them in the download cache instead. |
|
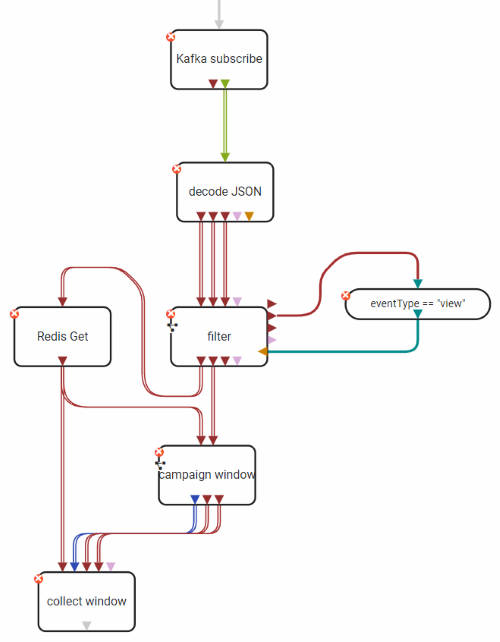
@revans2 I have updated Spark to 1.6 and Flink to 1.1 in this PR. I am now able to run the benchmarks successfully on a multi-node cluster as well as locally. Can you please help me make sense of seen.txt and updated.txt data ? So we have the following data in these files
What is the relation between the seen and updated values here? Specifically, how can I use this data to generate a latency graph, like the one below (source). Would really apprecite if you could help me with this.
|

|
Ditto, it would be great to have the methodology and possibly necessary scripts posted to the repo. |
|
@mmozum How about we try and make sense of these benchmarks together? Have you been able to make any progress ? |
|
I am also not able to understand the results of seen.txt and update.txt and how we can use it to generate report. 2)Count of values in seen.txt and update.txt would be benchmark duration*(number of campaigns/window duration). e.g 100s*(100/10)=1000 in our case. 3)So the way you plot the given graph for processing time vs percent of tuples processed might be the percentage value(like 1,20,25,50 in your case) of total records which emitted after filter phase taken from seen.txt and its corresponding latency in updated.txt. Please let me know if my understanding is correct or not? |
|
I also try to make sense of the update.txt. It gives the following according to code. This value is for the last event for a time window. window.last_updated_at – window.timestamp The documentation says, in order to calculate the latency we need to subtract window.duration from the above value in update.txt. The problem is this gives negative values for latency. window.final_event_latency = (window.last_updated_at – window.timestamp) – window.duration I'm not event sure the way they calculate latency is correct. Because they use the currentMillis in the tasks and the timestamp generated by the client. According to code, the window.last_updated_at also written by a thread, which runs every 1 second. So I'm not convinced this is correct. |
|
Gentle bump, has anyone figured out what seen.txt and updated.txt are supposed to mean, and how to draw the graphs from them? |
|
I am also confused about the meaning of the values in seen.txt and updated.txt. Any answer is helpful. |
|
I had the same troubles but I think I can shed some light on that. We used the Streaming Benchmark to see how our solution performs and wanted to compare the results with those of Apache Spark and Apache Storm. For that, of course we needed to interpret the results correctly. How it works
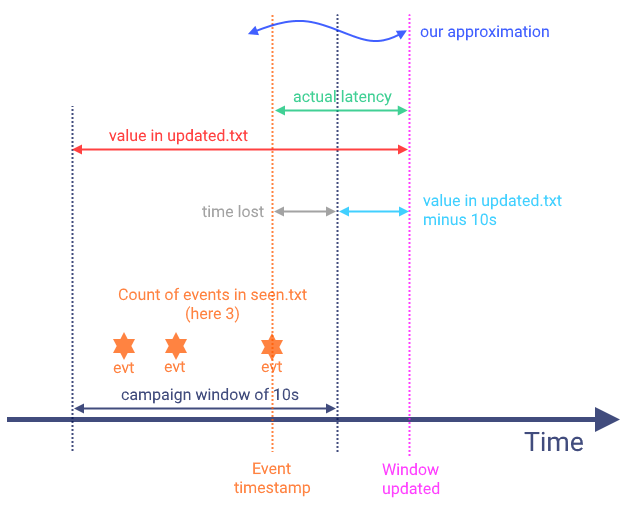
How we approximated the actual latencyThe illustration below shows how the values in We approximated the actual latency by this formula:
The problem here is that the time span between the last event and the window end will get lost (gray). Of course, the above formula only works if you assume evenly distributed events over time. Also, the fact that the measurement is distorted by only updated each second remains an issue. However, this applies to all tested frameworks so comparing results still tells differences in latency. I hope this helps a bit. If you are interested in how we used this benchmark check our blog post about it: https://bitspark.de/blog/benchmarking-slang |
@rmetzger I bumped the versions for Spark, Storm and Flink (also had to modify some pom files) to successfully run benchmarks for all of them but I am having a hard time making sense of the data produced by the benchmarks. Can you please give me some pointers as to how I can use the seen.txt and updated.txt data to generate graphs for the latency characteristics of the frameworks as shown in this post.
The text was updated successfully, but these errors were encountered: