Working with MPCCD images
We use the MPCCD Octal detector for SFX experiments. It consists of eight sensor panels (or modules).
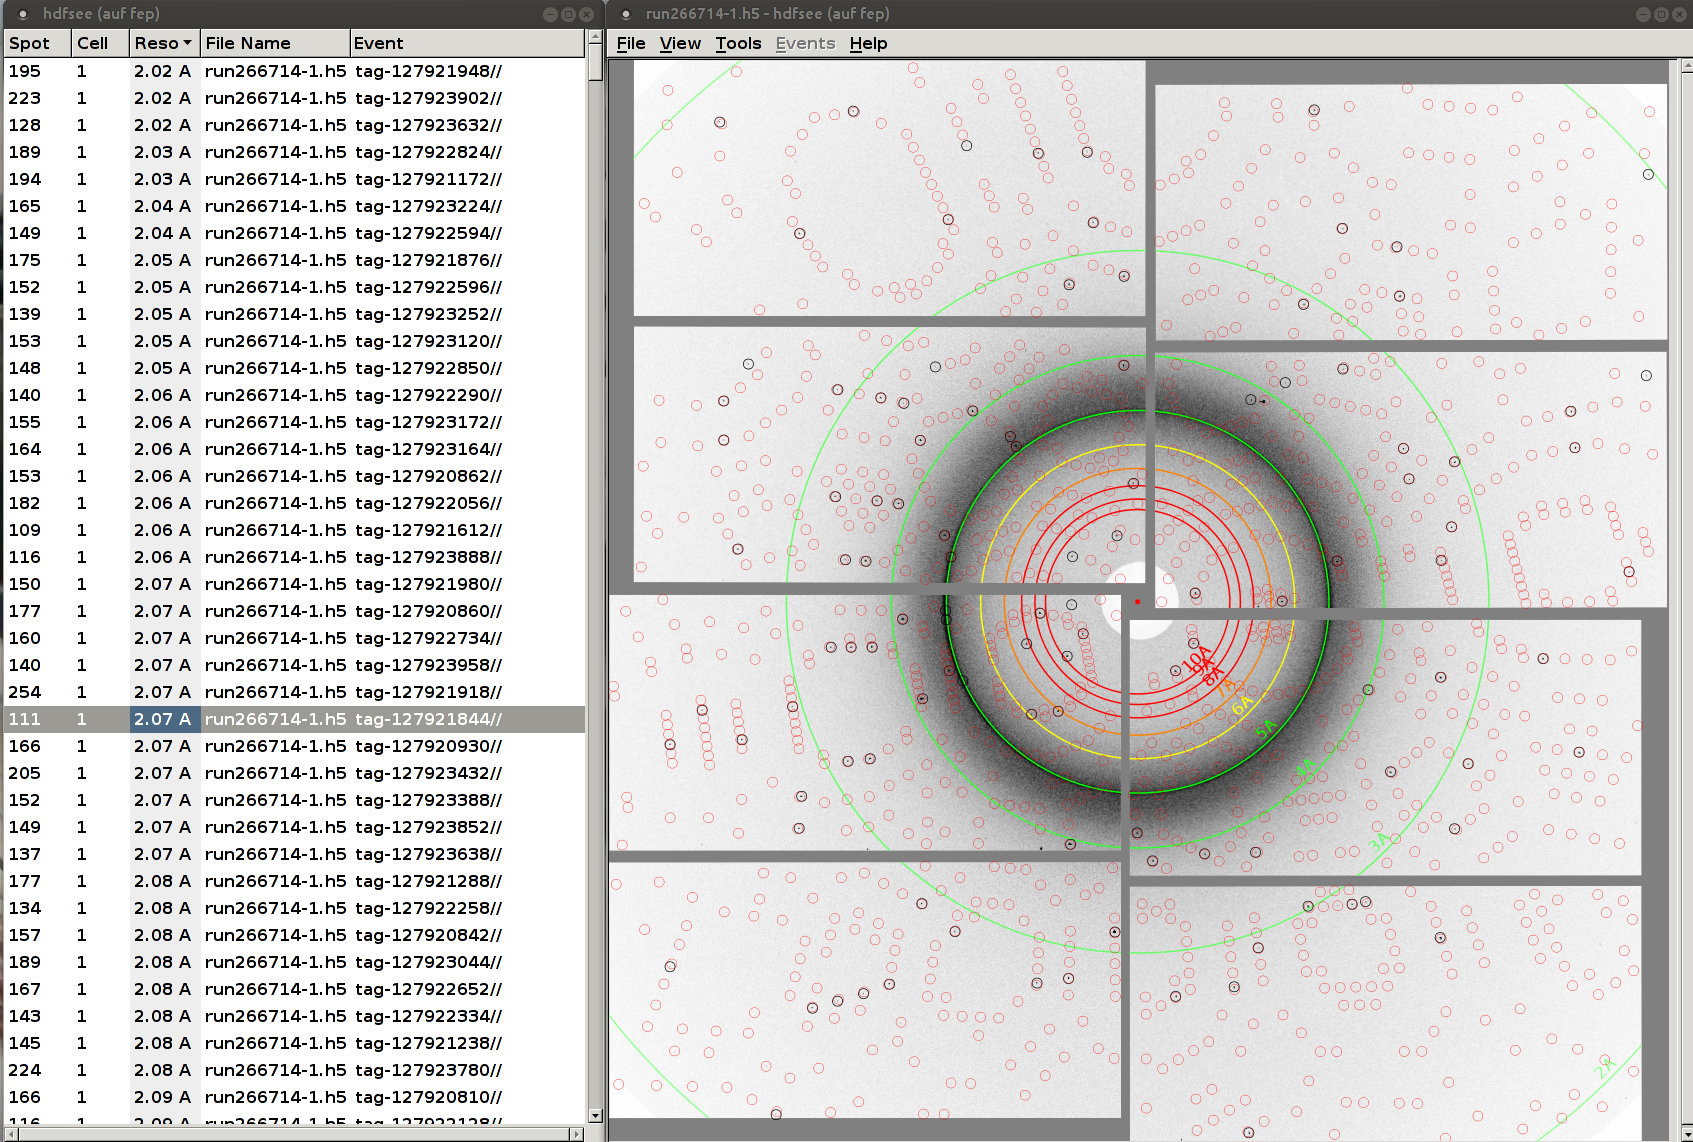
The full well depth of MPCCD is about 3,325,000 (phase III) or 3,800,000 (compact) electrons. Note that the values Cheetah outputs are not the numbers of electrons but the numbers of photons multiplied by 10.
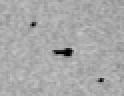
If the beam is too strong, the signals are 'spilt' to the neighboring pixels in the read out direction (long edge),
and causes pixel streaking. See the middle spot in the image above.
As long as the integration box size (--int-radius) is big enough, it does not affect
data quality very much (tested on several phasing datasets).
Thus, We do not reject saturated spots (do not specify --max-adu).
HOWEVER, too strong beams irreversibly damage the detector! At the same time, you cannot bring out full diffraction potential of your crystals with too much attenuation. This is a trade-off. You should discuss this issue with your beamline scientists (the author of this documentation does not represent the SACLA facility).
Since April 2017, the compact MPCCD is in operation. This fixes a bug in older MPCCDs that led to the loss of
intensities when saturation occurred. In the compact MPCCD, the total intensities are preserved when spilt
pixels were summed together. However, it has X-ray shields (20 - 25 px wide) over amplifiers located at the edges,
so the effective pixel area is slightly smaller than older MPCCDs.
If you use higher energy (>= 10 keV), you might want to request the phase 3 MPCCD.
Its sensor thickness is 300 um, five times thicker than other MPCCDs.
This provides higher DQE at higher photon energies.
Actually, its back-thinned layout provides higher DQE even at 7 keV, but the difference is
smaller.
The edge pixels (5 px) around phase 3 MPCCDs are unreliable and should be masked. Moreover, the sensor thickness may cause a parallax effect that leads to radial spot elongation at high angles. This can in principle be modeled in DIALS, but not in the current version of CrystFEL.
The pipeline automatically defines appropriate masks in the CrystFEL geometry file it generates.
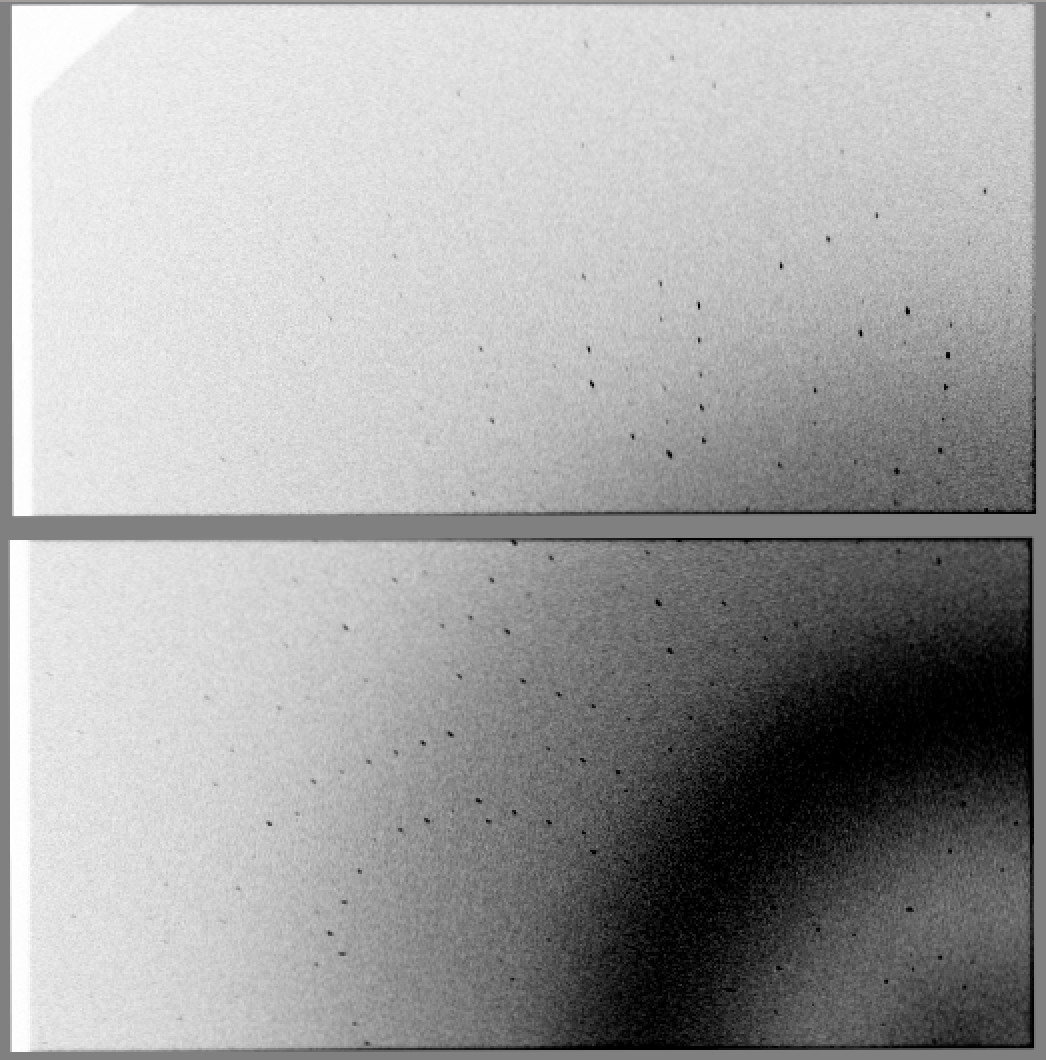
The image above shows the upper-left quadrant of an image from a phase-3 MPCCD detector. Notice blank (white) borders at the left. These are shadows from amplifier shields. They are also present in the compact MPCCD. The dark edges (prominent at the right) are unreliable pixels specific to a phase-3 detector. Finally, note the radial spot elongations due to parallax and bandwidth (1.5 %).
When beam line engineers deploy the detector to the DAPHNIS platform, they do their best to place the detector perpendicular to the beam. However, some errors are unavoidable.
Unfortunately, geoptimiser cannot refine tilt and twist, although the latest version (0.6.3) of CrystFEL
allows the z component in the detector fast and slow axis. In principle, we can
refine tilt and twist in DIALS and convert the geometry JSON file to the CrystFEL format.
We have not tested this yet.
In practice, tilt and twist are absorbed into other refined parameters during geoptimiser.