This script will read all of the deployed resources out of the Elastic Cloud Enterprise deployments API, format and bulk load the results into an Elasticsearch cluster of choice, and create a new field in each document called cluster_name_combined for aggregations across the different document types for each resource.
NOTE: This has been tested in lab conditions within a fresh install of ECE 2.12 and an ECE 2.9 install that was upgraded over time from 1.0.
- An ECE environment
- jq-linux64 (Download here: https://stedolan.github.io/jq/download/)
- A target Elasticsearch cluster to load data
- Install jq-linix64 in the same directory at the script
- Copy the script locally and modify appropriate variables at the start of the script
- If you encounter errors or hangs while runnint the script re-check your variables
- Create Kibana index patters for the index you created
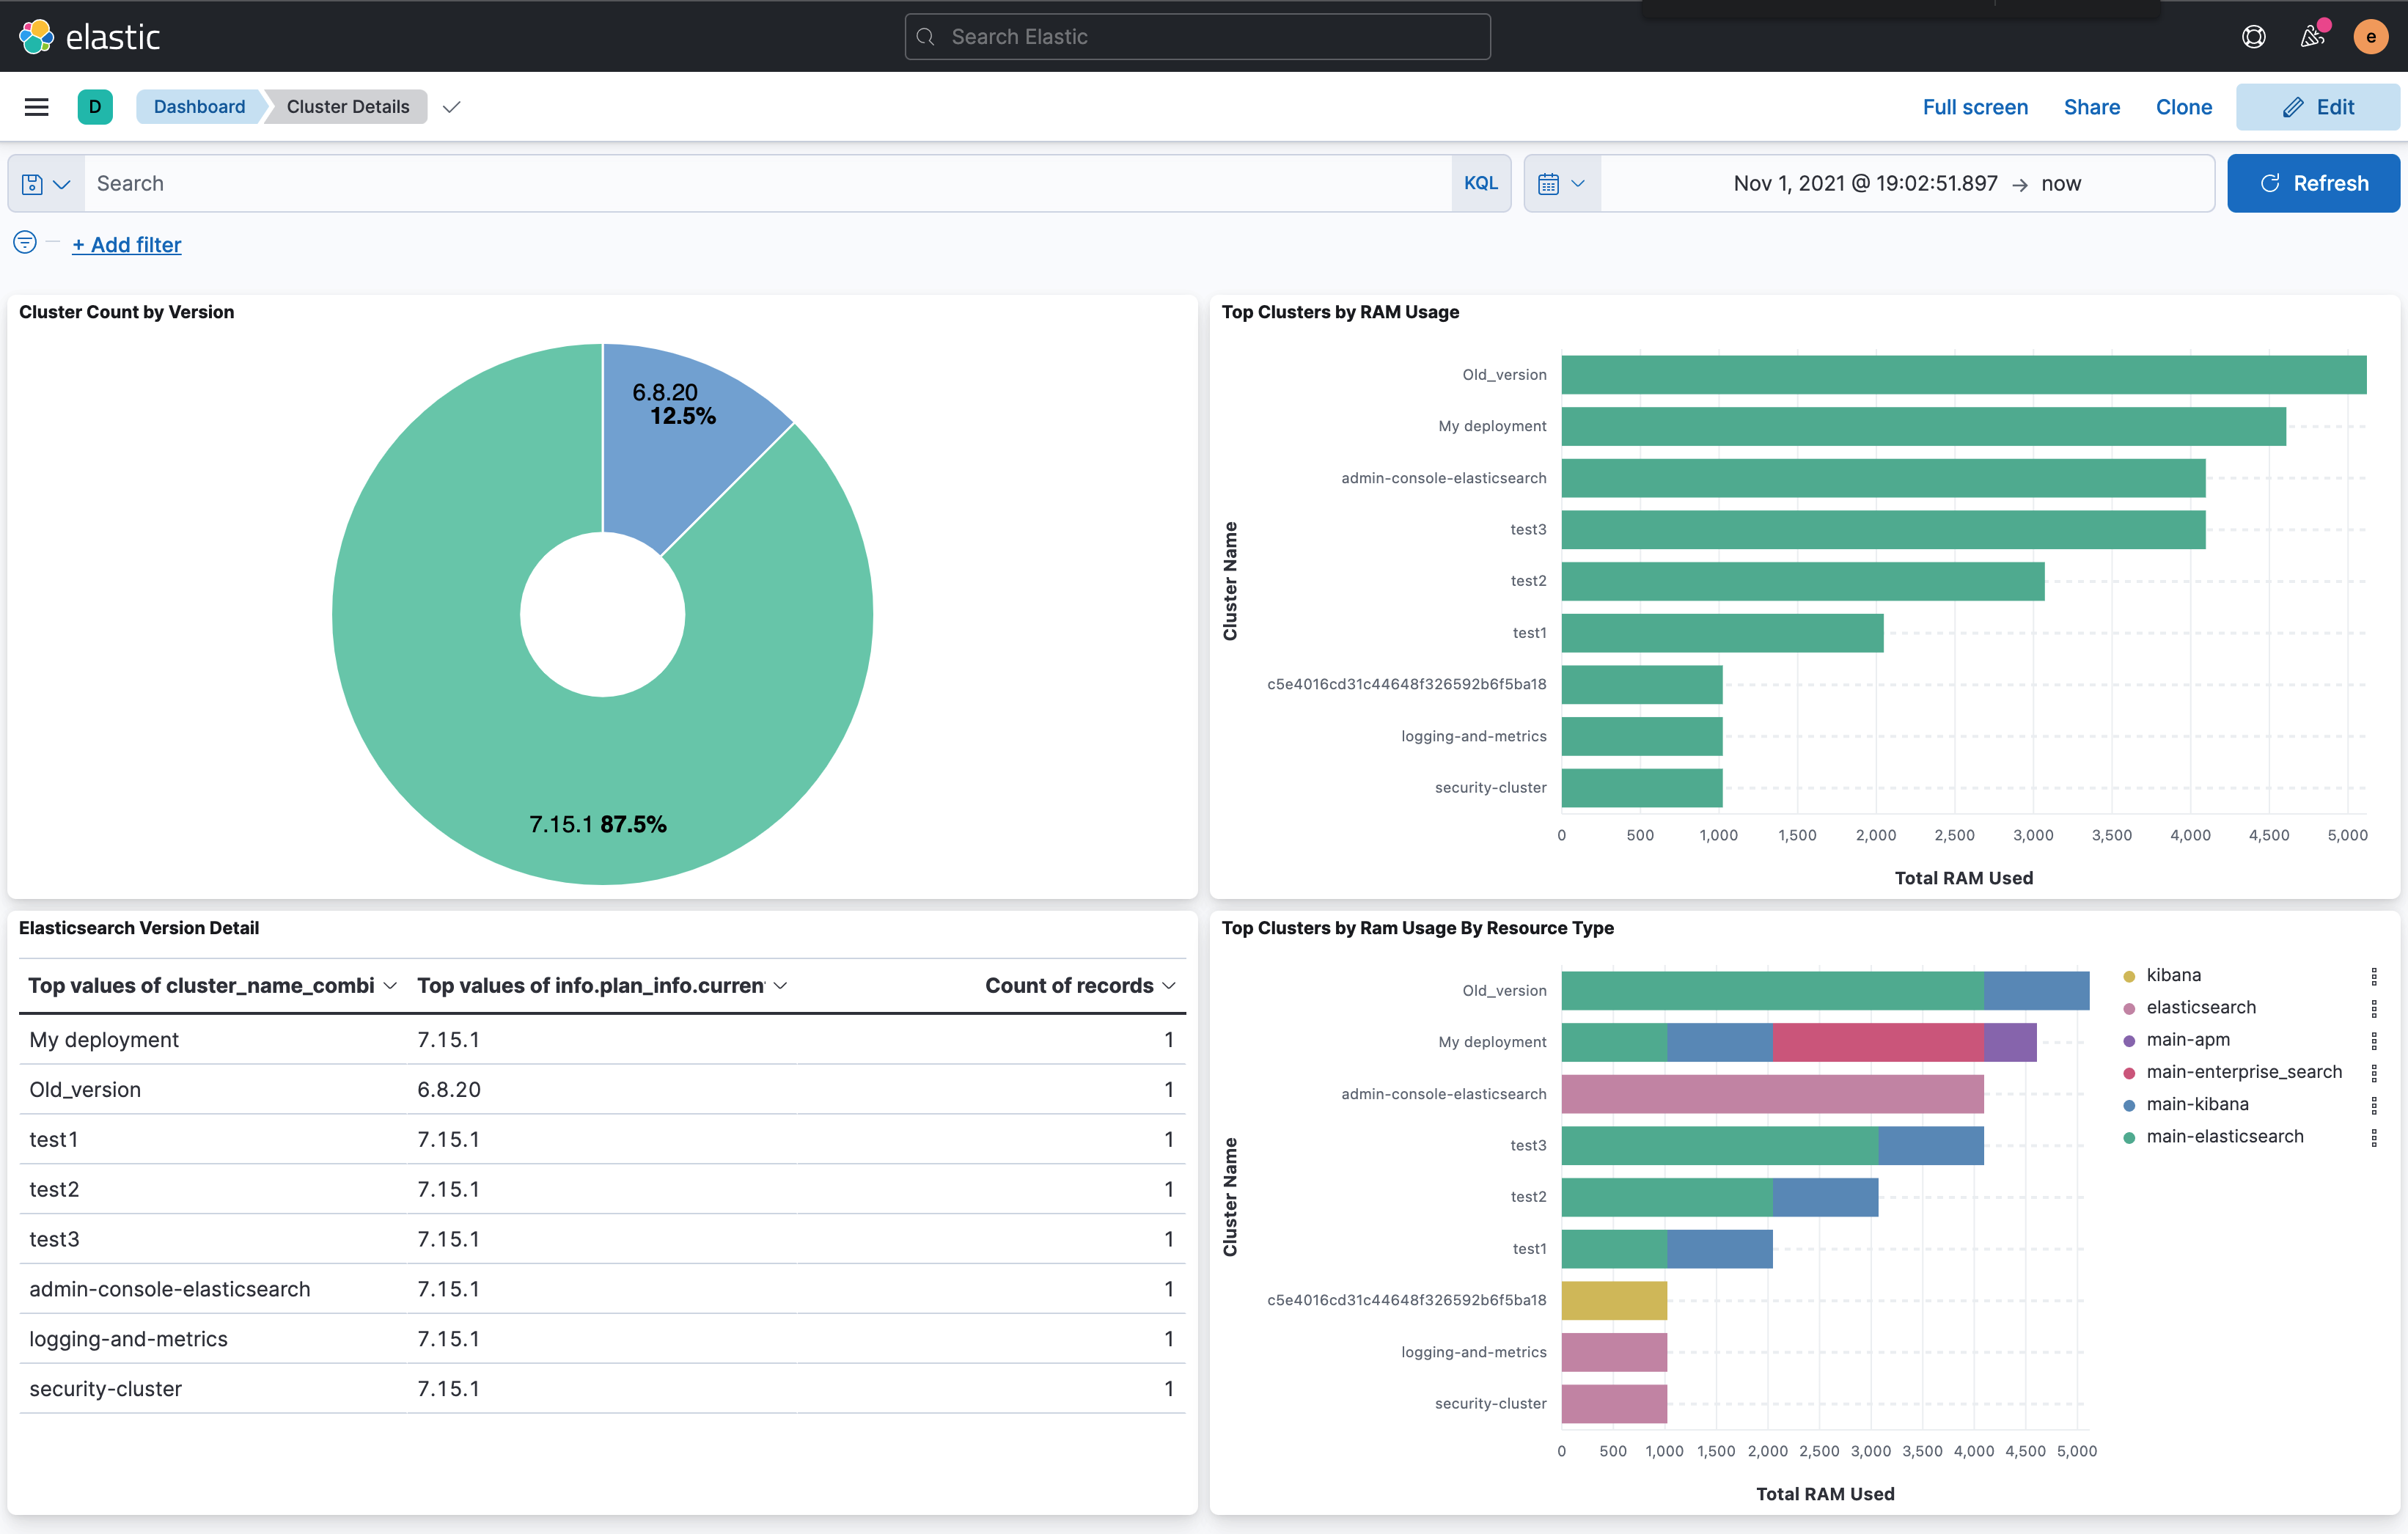
- When visualizating data use the common field cluster_name_combined
You can do so much more than this, but a simple dashboard shows top clusters by ram used with a breakdown of ECE node types used along with version breakdown.