A demo showcasing the Skender.Stock.Indicators NuGet package with an Angular frontend, Chart.js charting, and a .NET Web API backend for financial indicators. See the library documentation for more examples, guides, and available indicators.
Live demo: charts.StockIndicators.dev
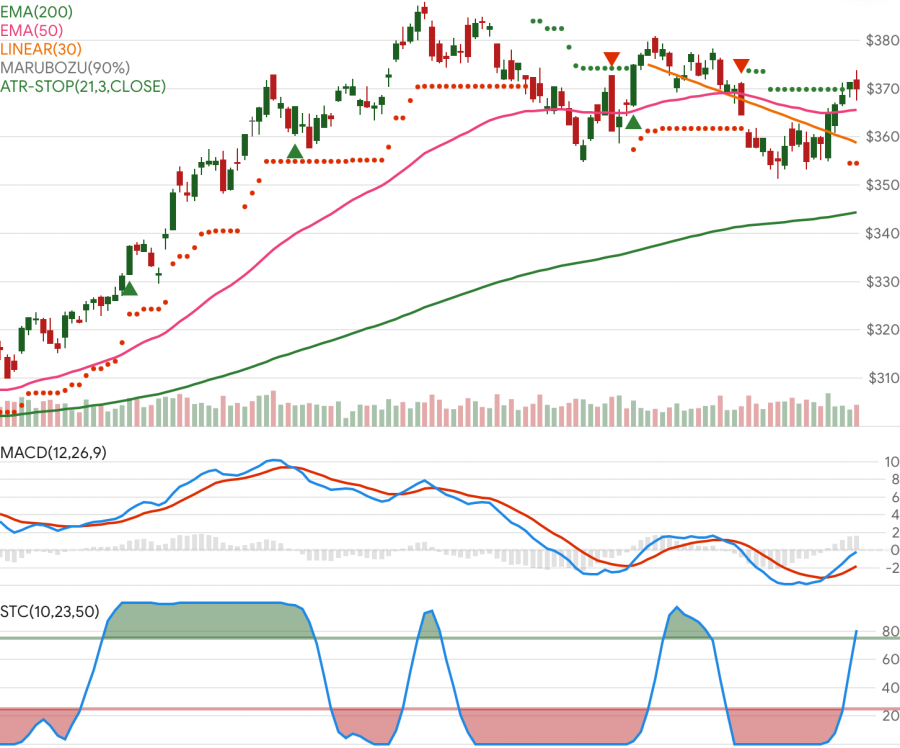
This repo and charting tool is primarily intended to demonstrate the Stock Indicators for .NET library. It is not meant to be a fully featured charting system and may not be an architectural model that works for your use case. If you need a mature charting tool, please explore all of your charting and visualization options.
All platforms:
- Git
- Node.js (v24.13.1 LTS or later)
- pnpm (v10.29.3 or later) - Installed via platform package managers:
- macOS: Homebrew (
brew install pnpm) - Windows: winget (
winget install pnpm.pnpm) - Linux: Corepack (
corepack enable && corepack prepare pnpm@10.29.3 --activate)
- macOS: Homebrew (
- Angular CLI - Installed globally during setup
- .NET SDK (v10.0 or later)
- Azure Functions Core Tools (v4) - Required for backend development
- Visual Studio Code (recommended) or Visual Studio
Quick setup (all platforms):
bash scripts/setup-environment.shThis script automatically detects your OS and runs the appropriate platform-specific setup.
Platform-specific setup scripts:
- macOS:
scripts/setup-macos.sh(Homebrew-based) - Linux:
scripts/setup-linux.sh(apt-get-based) - Windows:
scripts/setup-windows.sh(Git Bash with winget)
Note: All setup scripts automatically install Node.js, .NET SDK, pnpm, and Angular CLI. Azure Functions Core Tools is installed automatically on macOS and Windows, but must be installed manually on Linux.
Note: Azure Functions Core Tools is essential for running the backend Azure Functions locally (func start command). It is not installed automatically with Node or .NET SDK.
# Clone and install
git clone https://github.com/facioquo/stock-charts.git
cd stock-charts
pnpm install

# Start development environment
# Option 1: Use VS Code
# Ctrl+Shift+P → "Tasks: Run Task" → "start-full-stack"

# Option 2: Manual start in separate terminals
pnpm run azure:start  # Terminal 1: Storage emulator
cd server/Functions && func start  # Terminal 2: Azure Functions
cd server/WebApi && dotnet run  # Terminal 3: Web API
pnpm start  # Terminal 4: Angular dev server
Access: Website at http://localhost:4200, Web API at https://localhost:5001, Functions at http://localhost:7071
Financial chart support (candlestick, ohlc) is integrated as a typed, modular Chart.js extension under client/src/chartjs/financial.
- Register once at startup with
registerFinancialCharts()(already called fromclient/src/main.ts). - Use OHLC data points in
{ x, o, h, l, c }shape wherexis a timestamp. - Theme candle/volume colors via
getFinancialPalette()+applyFinancialElementTheme(). - Use factories (
buildCandlestickDataset,buildVolumeDataset,buildFinancialChartOptions) for consistent typed chart config. - For large datasets (5k-10k candles), prefer
animation: false, keep tooltip interaction non-intersecting, and avoid unnecessary redraws.
This integration is derived from chartjs-chart-financial and keeps upstream license attribution in source headers.
For AI coding agents (GitHub Copilot, Claude, etc.), see AGENTS.md for comprehensive project context including:
- Primary and secondary directives
- Repository structure with permissions
- Commands and code style patterns
- Technology conventions and boundaries
- Development workflow
For detailed development setup, testing, linting, formatting, and contribution workflow, see Contributing Guidelines.
This project is licensed under the Apache 2.0 License - see LICENSE for details.