forked from grafana/jsonnet-libs
-
Notifications
You must be signed in to change notification settings - Fork 1
update mssql candidate #5
New issue
Have a question about this project? Sign up for a free GitHub account to open an issue and contact its maintainers and the community.
By clicking “Sign up for GitHub”, you agree to our terms of service and privacy statement. We’ll occasionally send you account related emails.
Already on GitHub? Sign in to your account
Open
l8zydaz
wants to merge
3
commits into
master
Choose a base branch
from
mssql-updates
base: master
Could not load branches
Branch not found: {{ refName }}
Loading
Could not load tags
Nothing to show
Loading
Are you sure you want to change the base?
Some commits from the old base branch may be removed from the timeline,
and old review comments may become outdated.
Open
Changes from all commits
Commits
Show all changes
3 commits
Select commit
Hold shift + click to select a range
File filter
Filter by extension
Conversations
Failed to load comments.
Loading
Jump to
Jump to file
Failed to load files.
Loading
Diff view
Diff view
There are no files selected for viewing
This file contains hidden or bidirectional Unicode text that may be interpreted or compiled differently than what appears below. To review, open the file in an editor that reveals hidden Unicode characters.
Learn more about bidirectional Unicode characters
| Original file line number | Diff line number | Diff line change |
|---|---|---|
| @@ -0,0 +1,34 @@ | ||
| JSONNET_FMT := jsonnetfmt -n 2 --max-blank-lines 1 --string-style s --comment-style s | ||
|
|
||
| .PHONY: all | ||
| all: build dashboards_out prometheus_alerts.yaml | ||
|
|
||
| vendor: jsonnetfile.json | ||
| jb install | ||
|
|
||
| .PHONY: build | ||
| build: vendor | ||
|
|
||
| .PHONY: fmt | ||
| fmt: | ||
| find . -name 'vendor' -prune -o -name '*.libsonnet' -print -o -name '*.jsonnet' -print | \ | ||
| xargs -n 1 -- $(JSONNET_FMT) -i | ||
|
|
||
| .PHONY: lint | ||
| lint: build | ||
| find . -name 'vendor' -prune -o -name '*.libsonnet' -print -o -name '*.jsonnet' -print | \ | ||
| while read f; do \ | ||
| $(JSONNET_FMT) "$$f" | diff -u "$$f" -; \ | ||
| done | ||
| mixtool lint mixin.libsonnet | ||
|
|
||
| dashboards_out: mixin.libsonnet config.libsonnet dashboards.libsonnet | ||
| @mkdir -p dashboards_out | ||
| mixtool generate dashboards mixin.libsonnet -d dashboards_out | ||
|
|
||
| prometheus_alerts.yaml: mixin.libsonnet alerts.libsonnet | ||
| mixtool generate alerts mixin.libsonnet -a prometheus_alerts.yaml | ||
|
|
||
| .PHONY: clean | ||
| clean: | ||
| rm -rf dashboards_out prometheus_alerts.yaml |
This file contains hidden or bidirectional Unicode text that may be interpreted or compiled differently than what appears below. To review, open the file in an editor that reveals hidden Unicode characters.
Learn more about bidirectional Unicode characters
| Original file line number | Diff line number | Diff line change |
|---|---|---|
| @@ -0,0 +1,66 @@ | ||
| # Clickhouse Mixin | ||
|
|
||
| Clickhouse mixin is a set of configurable, reusable and extensible alerts and dashboards that uses the [Clickhouse Exporter](https://github.com/ClickHouse/clickhouse_exporter) for Prometheus and Loki for logs (optional). | ||
|
|
||
| The Clickhouse mixin includes the following dashboards: | ||
| - Clickhouse overview | ||
| - Clickhouse latency | ||
| - Clickhouse replica | ||
|
|
||
| ## Clickhouse overview: | ||
|
|
||
| The Clickhouse overview dashboard provides details on queries, memory usage, networking and error logs. To get Clickhouse error logs, [Promtail and Loki needs to be installed](https://grafana.com/docs/loki/latest/installation/) and provisioned for logs with your Grafana instance. The default Clickhouse error log path is `/var/log/clickhouse-server/clickhouse-server.err.log`. | ||
|
|
||
| 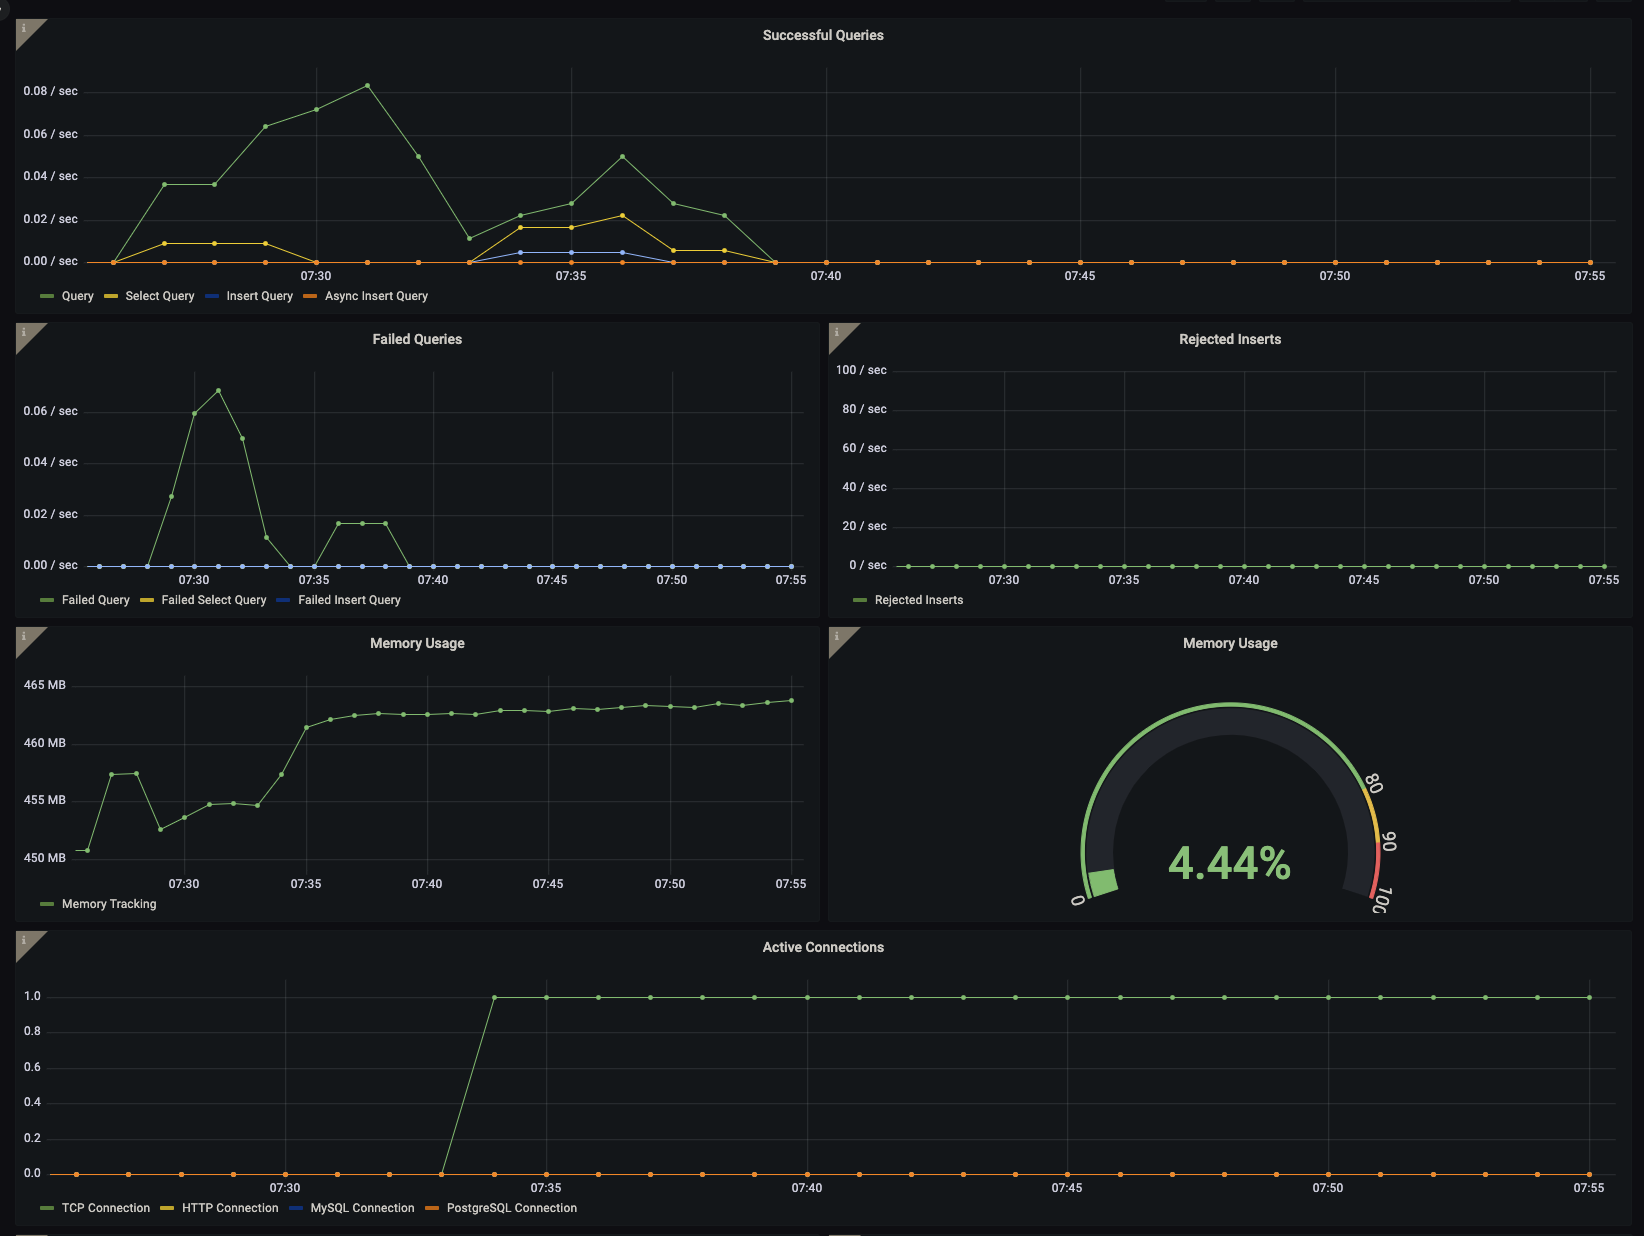 | ||
| 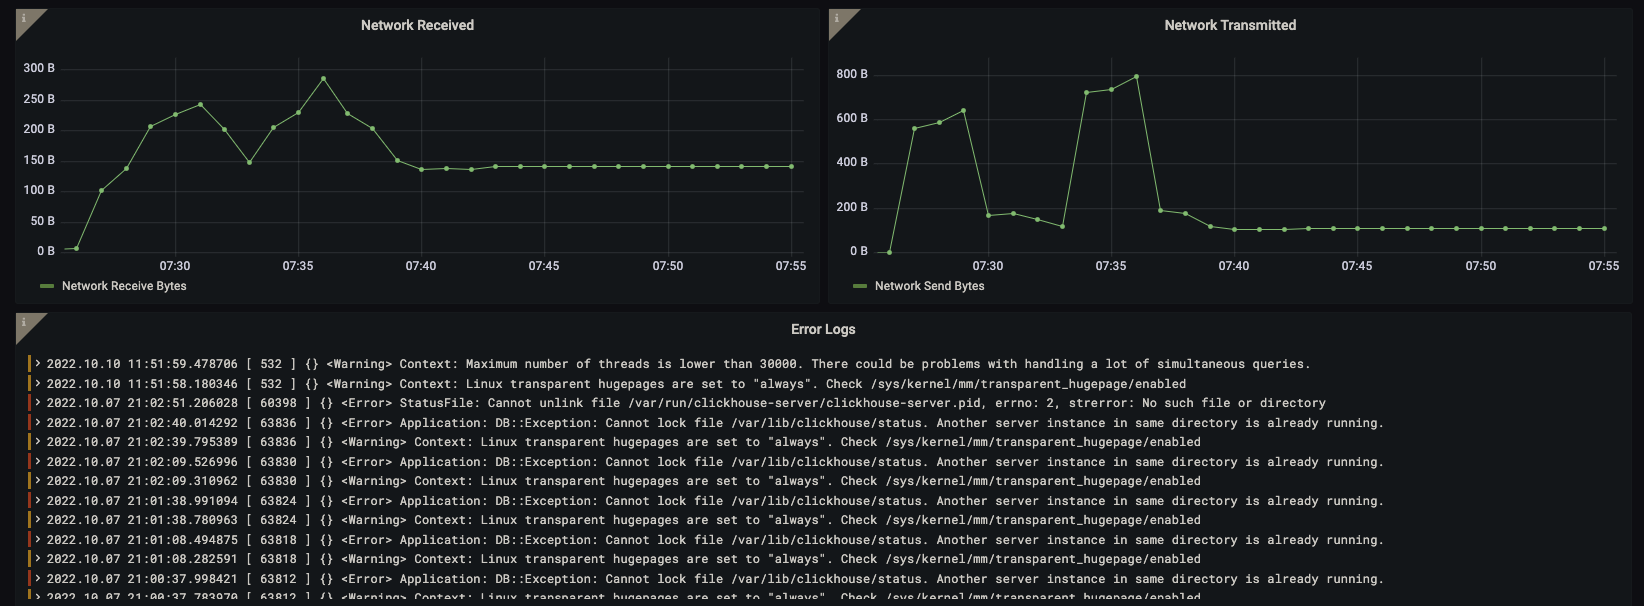 | ||
|
|
||
|
|
||
| Clickhouse error logs are enabled by default in the `config.libsonnet` and can be removed by setting `enableLokiLogs` to `false`. Then run `make` again to regenerate the dashboard: | ||
|
|
||
| ``` | ||
| { | ||
| _config+:: { | ||
| enableLokiLogs: true, | ||
| }, | ||
| } | ||
| ``` | ||
|
|
||
| ## Clickhouse latency: | ||
|
|
||
| The Clickhouse latency dashboard provides details on latency metrics. | ||
| 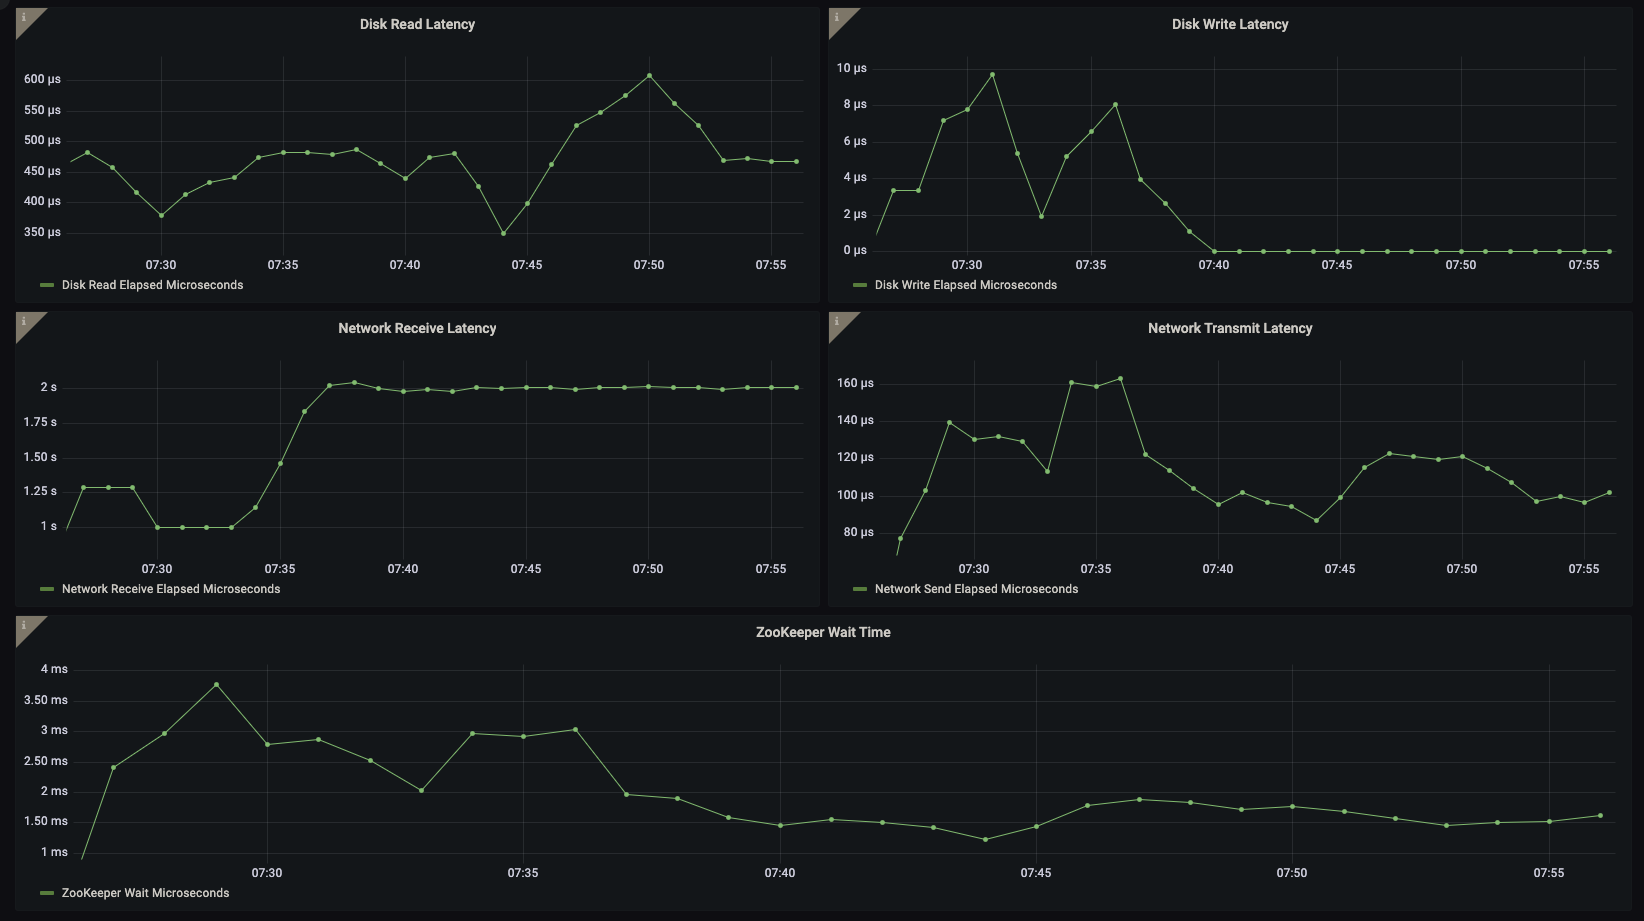 | ||
|
|
||
| ## Clickhouse replica: | ||
|
|
||
| The Clickhouse replica dashboard provides details on replica metrics. | ||
| 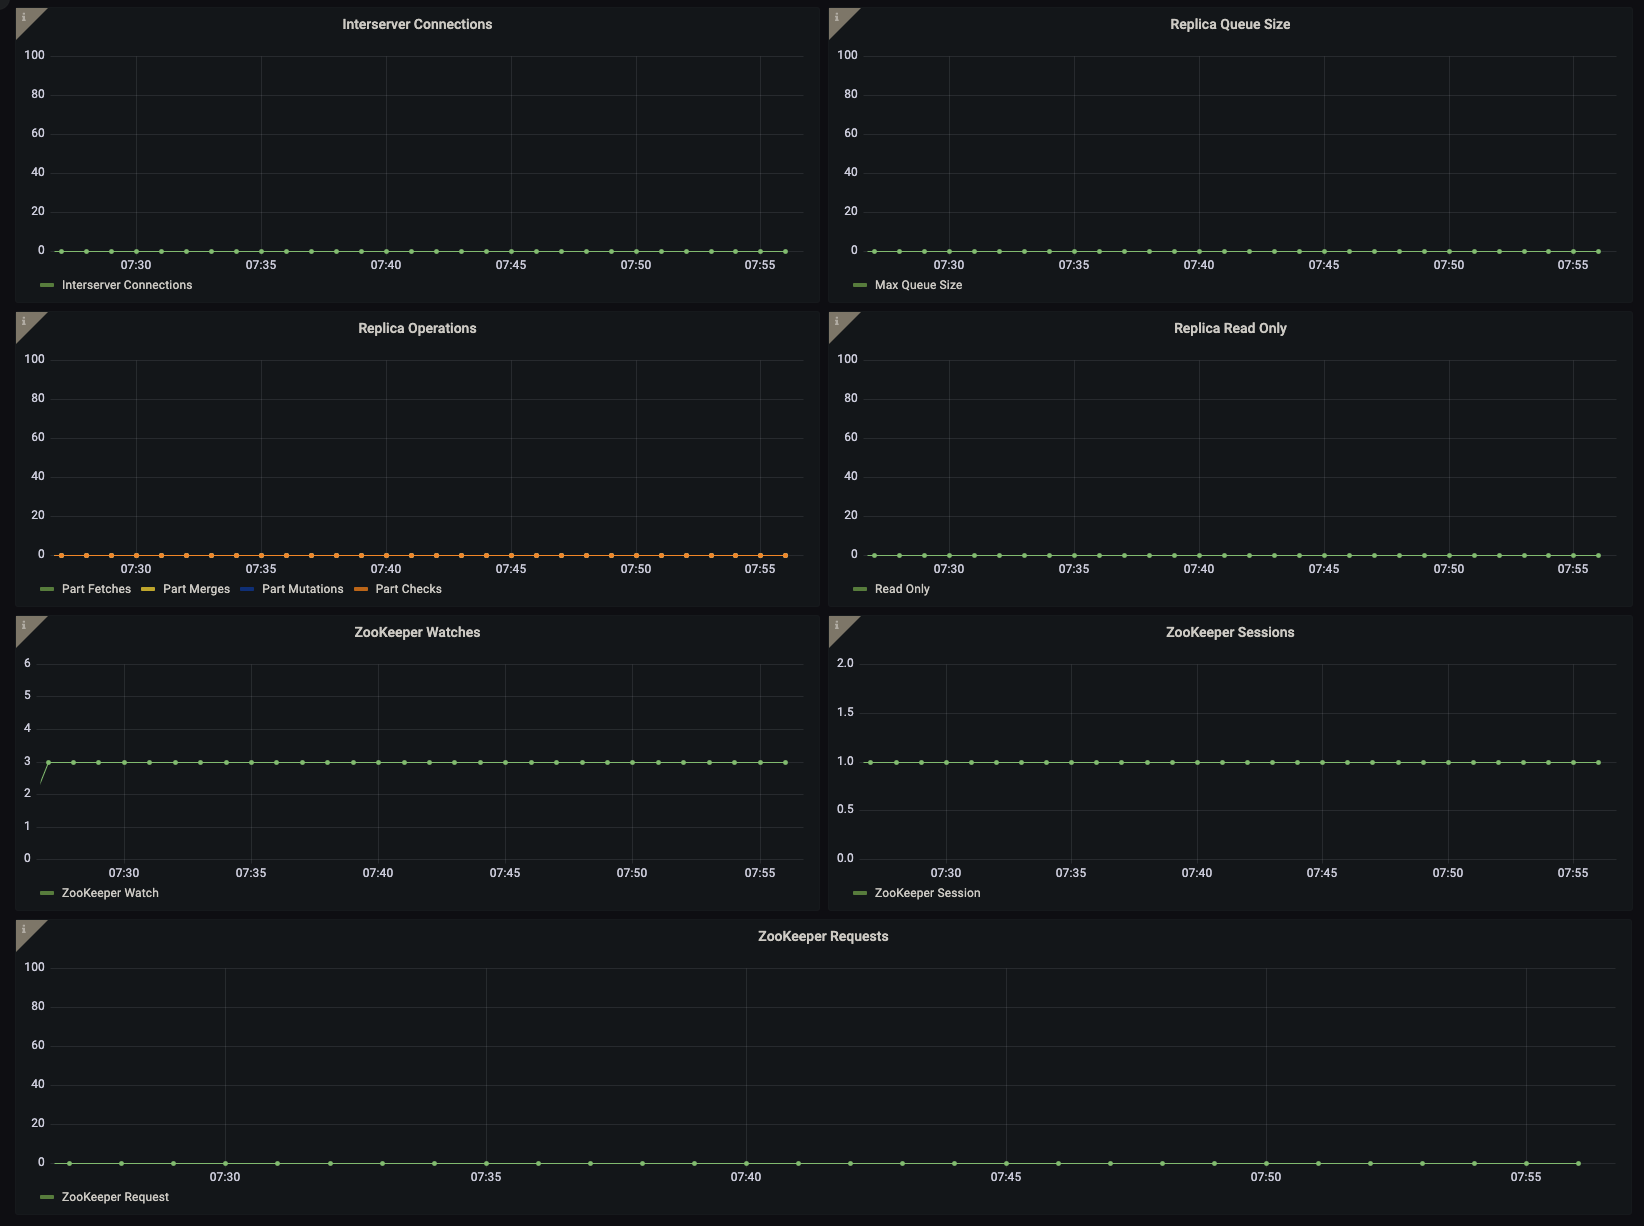 | ||
|
|
||
| ## Install tools | ||
|
|
||
| ```bash | ||
| go install github.com/jsonnet-bundler/jsonnet-bundler/cmd/jb@latest | ||
| go install github.com/monitoring-mixins/mixtool/cmd/mixtool@latest | ||
| ``` | ||
|
|
||
| For linting and formatting, you would also need and `jsonnetfmt` installed. If you | ||
| have a working Go development environment, it's easiest to run the following: | ||
|
|
||
| ```bash | ||
| go install github.com/google/go-jsonnet/cmd/jsonnetfmt@latest | ||
| ``` | ||
|
|
||
| The files in `dashboards_out` need to be imported | ||
| into your Grafana server. The exact details will be depending on your environment. | ||
|
|
||
| `prometheus_alerts.yaml` needs to be imported into Prometheus. | ||
|
|
||
| ## Generate dashboards and alerts | ||
|
|
||
| Edit `config.libsonnet` if required and then build JSON dashboard files for Grafana: | ||
|
|
||
| ```bash | ||
| make | ||
| ``` | ||
|
|
||
| For more advanced uses of mixins, see | ||
| https://github.com/monitoring-mixins/docs. |
This file contains hidden or bidirectional Unicode text that may be interpreted or compiled differently than what appears below. To review, open the file in an editor that reveals hidden Unicode characters.
Learn more about bidirectional Unicode characters
| Original file line number | Diff line number | Diff line change |
|---|---|---|
| @@ -0,0 +1,19 @@ | ||
| { | ||
| new(this): { | ||
| // Add your alerts here | ||
| // Example: | ||
| // exampleAlert: | ||
| // { | ||
| // alert: 'ExampleAlert', | ||
| // expr: 'up == 0', | ||
| // 'for': '5m', | ||
| // labels: { | ||
| // severity: 'critical', | ||
| // }, | ||
| // annotations: { | ||
| // summary: 'Instance {{ $labels.instance }} down', | ||
| // description: '{{ $labels.instance }} of job {{ $labels.job }} has been down for more than 5 minutes.', | ||
| // }, | ||
| // }, | ||
| }, | ||
| } | ||
This file contains hidden or bidirectional Unicode text that may be interpreted or compiled differently than what appears below. To review, open the file in an editor that reveals hidden Unicode characters.
Learn more about bidirectional Unicode characters
| Original file line number | Diff line number | Diff line change |
|---|---|---|
| @@ -0,0 +1,28 @@ | ||
| { | ||
| // any modular library should include as inputs: | ||
| // 'dashboardNamePrefix' - Use as prefix for all Dashboards and (optional) rule groups | ||
| // 'filteringSelector' - Static selector to apply to ALL dashboard variables of type query, panel queries, alerts and recording rules. | ||
| // 'groupLabels' - one or more labels that can be used to identify 'group' of instances. In simple cases, can be 'job' or 'cluster'. | ||
| // 'instanceLabels' - one or more labels that can be used to identify single entity of instances. In simple cases, can be 'instance' or 'pod'. | ||
| // 'uid' - UID to prefix all dashboards original uids | ||
|
|
||
| enableMultiCluster: false, | ||
| filteringSelector: 'job=~"integrations/influxdb"', | ||
| groupLabels: if self.enableMultiCluster then ['job', 'cluster'] else ['job'], | ||
| instanceLabels: ['instance'], | ||
| dashboardTags: ['influxdb-mixin'], | ||
| uid: 'influxdb', | ||
| dashboardNamePrefix: '', | ||
|
|
||
| // additional params | ||
| dashboardPeriod: 'now-30m', | ||
| dashboardTimezone: 'default', | ||
| dashboardRefresh: '1m', | ||
|
|
||
| // logs lib related | ||
| enableLokiLogs: true, | ||
| logLabels: if self.enableMultiCluster then ['job', 'instance', 'cluster', 'level'] else ['job', 'instance', 'level'], | ||
| extraLogLabels: [], // Required by logs-lib | ||
| logsVolumeGroupBy: 'level', | ||
| showLogsVolume: true, | ||
| } |
This file contains hidden or bidirectional Unicode text that may be interpreted or compiled differently than what appears below. To review, open the file in an editor that reveals hidden Unicode characters.
Learn more about bidirectional Unicode characters
| Original file line number | Diff line number | Diff line change |
|---|---|---|
| @@ -0,0 +1,115 @@ | ||
| local g = import './g.libsonnet'; | ||
| local logslib = import 'logs-lib/logs/main.libsonnet'; | ||
| { | ||
| local root = self, | ||
| new(this):: | ||
| local prefix = this.config.dashboardNamePrefix; | ||
| local links = this.grafana.links; | ||
| local tags = this.config.dashboardTags; | ||
| local uid = g.util.string.slugify(this.config.uid); | ||
| local vars = this.grafana.variables; | ||
| local annotations = this.grafana.annotations; | ||
| local refresh = this.config.dashboardRefresh; | ||
| local period = this.config.dashboardPeriod; | ||
| local timezone = this.config.dashboardTimezone; | ||
| local panels = this.grafana.panels; | ||
|
|
||
| { | ||
| mssql_overview: | ||
| g.dashboard.new(prefix + ' MSSQL overview') | ||
| + g.dashboard.withPanels( | ||
| g.util.grid.wrapPanels( | ||
| [ | ||
| panels.connectionsPanel { gridPos+: { h: 8, w: 12, x: 0, y: 0 } }, | ||
| panels.batchRequestsPanel { gridPos+: { h: 8, w: 12, x: 12, y: 0 } }, | ||
| panels.severeErrorsPanel { gridPos+: { h: 8, w: 12, x: 0, y: 8 } }, | ||
| panels.deadlocksPanel { gridPos+: { h: 8, w: 12, x: 12, y: 8 } }, | ||
| panels.osMemoryUsagePanel { gridPos+: { h: 8, w: 24, x: 0, y: 16 } }, | ||
| panels.memoryManagerPanel { gridPos+: { h: 8, w: 16, x: 0, y: 24 } }, | ||
| panels.committedMemoryUtilizationPanel { gridPos+: { h: 8, w: 8, x: 16, y: 24 } }, | ||
| panels.errorLogsPanel { gridPos+: { h: 8, w: 24, x: 0, y: 32 } }, | ||
| panels.databaseWriteStallDurationPanel { gridPos+: { h: 8, w: 12, x: 0, y: 41 } }, | ||
| panels.databaseReadStallDurationPanel { gridPos+: { h: 8, w: 12, x: 12, y: 41 } }, | ||
| panels.transactionLogExpansionsPanel { gridPos+: { h: 8, w: 24, x: 0, y: 49 } }, | ||
| ] | ||
| ) | ||
| ) | ||
| + root.applyCommon( | ||
| vars.singleInstance, | ||
| uid + '_mssql_overview', | ||
| tags, | ||
| links { mssqlOverview+:: {} }, | ||
| annotations, | ||
| timezone, | ||
| refresh, | ||
| period | ||
| ), | ||
|
|
||
| mssql_pages: | ||
| g.dashboard.new(prefix + ' MSSQL pages') | ||
| + g.dashboard.withPanels( | ||
| g.util.grid.wrapPanels( | ||
| [ | ||
| ] | ||
| ) | ||
| ) | ||
| + root.applyCommon( | ||
| vars.singleInstance, | ||
| uid + '_mssql_pages', | ||
| tags, | ||
| links { mssqlPages+:: {} }, | ||
| annotations, | ||
| timezone, | ||
| refresh, | ||
| period | ||
| ), | ||
|
|
||
| } | ||
| + | ||
| if this.config.enableLokiLogs then | ||
| { | ||
| logs: | ||
| logslib.new( | ||
| prefix + ' logs', | ||
| datasourceName=this.grafana.variables.datasources.loki.name, | ||
| datasourceRegex=this.grafana.variables.datasources.loki.regex, | ||
| filterSelector=this.config.filteringSelector, | ||
| labels=this.config.groupLabels + this.config.extraLogLabels, | ||
| formatParser=null, | ||
| showLogsVolume=this.config.showLogsVolume, | ||
| ) | ||
| { | ||
| dashboards+: | ||
| { | ||
| logs+: | ||
| // reference to self, already generated variables, to keep them, but apply other common data in applyCommon | ||
| root.applyCommon(super.logs.templating.list, uid=uid + '-logs', tags=tags, links=links { logs+:: {} }, annotations=annotations, timezone=timezone, refresh=refresh, period=period), | ||
| }, | ||
| panels+: | ||
| { | ||
| // modify log panel | ||
| logs+: | ||
| g.panel.logs.options.withEnableLogDetails(true) | ||
| + g.panel.logs.options.withShowTime(false) | ||
| + g.panel.logs.options.withWrapLogMessage(false), | ||
| }, | ||
| variables+: { | ||
| // add prometheus datasource for annotations processing | ||
| toArray+: [ | ||
| this.grafana.variables.datasources.prometheus { hide: 2 }, | ||
| ], | ||
| }, | ||
| }.dashboards.logs, | ||
| } | ||
| else {}, | ||
|
|
||
| applyCommon(vars, uid, tags, links, annotations, timezone, refresh, period): | ||
| g.dashboard.withTags(tags) | ||
| + g.dashboard.withUid(uid) | ||
| + g.dashboard.withLinks(std.objectValues(links)) | ||
| + g.dashboard.withTimezone(timezone) | ||
| + g.dashboard.withRefresh(refresh) | ||
| + g.dashboard.time.withFrom(period) | ||
| + g.dashboard.withVariables(vars) | ||
| + g.dashboard.withAnnotations(std.objectValues(annotations)), | ||
| } |
Oops, something went wrong.
Oops, something went wrong.
Add this suggestion to a batch that can be applied as a single commit.
This suggestion is invalid because no changes were made to the code.
Suggestions cannot be applied while the pull request is closed.
Suggestions cannot be applied while viewing a subset of changes.
Only one suggestion per line can be applied in a batch.
Add this suggestion to a batch that can be applied as a single commit.
Applying suggestions on deleted lines is not supported.
You must change the existing code in this line in order to create a valid suggestion.
Outdated suggestions cannot be applied.
This suggestion has been applied or marked resolved.
Suggestions cannot be applied from pending reviews.
Suggestions cannot be applied on multi-line comments.
Suggestions cannot be applied while the pull request is queued to merge.
Suggestion cannot be applied right now. Please check back later.
There was a problem hiding this comment.
Choose a reason for hiding this comment
The reason will be displayed to describe this comment to others. Learn more.
reminder we need to re-add the alerts here