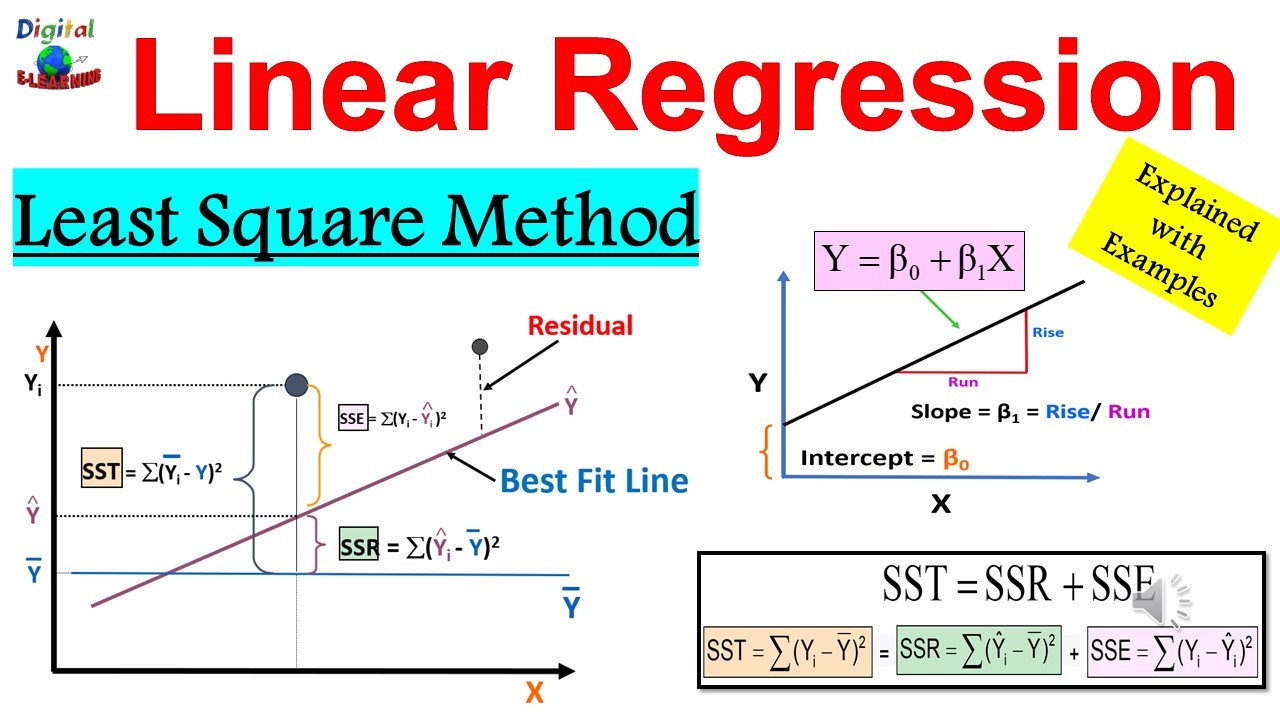
Linear regression is a fundamental statistical and machine learning technique that models the relationship between a scalar dependent variable and one or more explanatory variables (or independent variables). This project aims to provide a comprehensive analysis of both simple and multiple linear regression using Python.
Linear-regression-analysis/
│
├── data/
│   └── dataset.csv               # Dataset for the regression analysis
│
├── src/
│   ├── linear_regression.py      # Main script for implementing the regression model
│   └── utils.py                  # Utility functions to support the regression analysis
│
└── README.md
- Simple Linear Regression: Implement and understand the simplest form of linear regression involving two variables.
- Multiple Linear Regression: Explore how multiple features can be used to predict a response.
- Model Evaluation: Utilize metrics like R-squared, Adjusted R-squared, and MSE to evaluate the model.
- Prediction: Use the model to make predictions on new data.
- Visualization: Plot the results using libraries such as Matplotlib.
Ensure you have Python installed on your system. You can download Python from here. Additionally, you will need some packages, which you can install using pip:
pip install numpy scipy pandas matplotlib sklearn
To run the model, navigate to the src directory and execute the following command:
python linear_regression.py
-
Data Loading:
dataset.csvis loaded into a Pandas DataFrame.- Example:
data = pd.read_csv('../data/dataset.csv')
-
Data Preprocessing:
- Handling missing values, if any.
- Splitting data into features and labels.
- Normalizing/scaling the features if required.
- Splitting the data into training and testing sets.
- Example:
train_test_split(data, test_size=0.2, random_state=42)
-
Model Training:
- Creating a linear regression model instance from a library like sklearn.
- Fitting this model on the training data.
- Example:
model.fit(X_train, y_train)
-
Model Testing:
- Predicting the responses for the test dataset using the trained model.
- Example:
predictions = model.predict(X_test)
-
Performance Metrics:
- Calculating and printing various performance metrics such as R-squared, MSE, etc.
- Example:
print('R-squared:', r2_score(y_test, predictions))
-
Visualization:
- Using Matplotlib to create plots showing the actual vs predicted values or the regression line.
- Example:
plt.scatter(X_test, y_test); plt.plot(X_test, predictions, color='red'); plt.show()
Contributions to this project are welcome! Please fork the repository and submit a pull request with your suggested changes. Ensure that your changes adhere to the project's coding and documentation standards.
