Status
Monitor provider health with live incident tracking and scheduled maintenance across 22 AI providers.
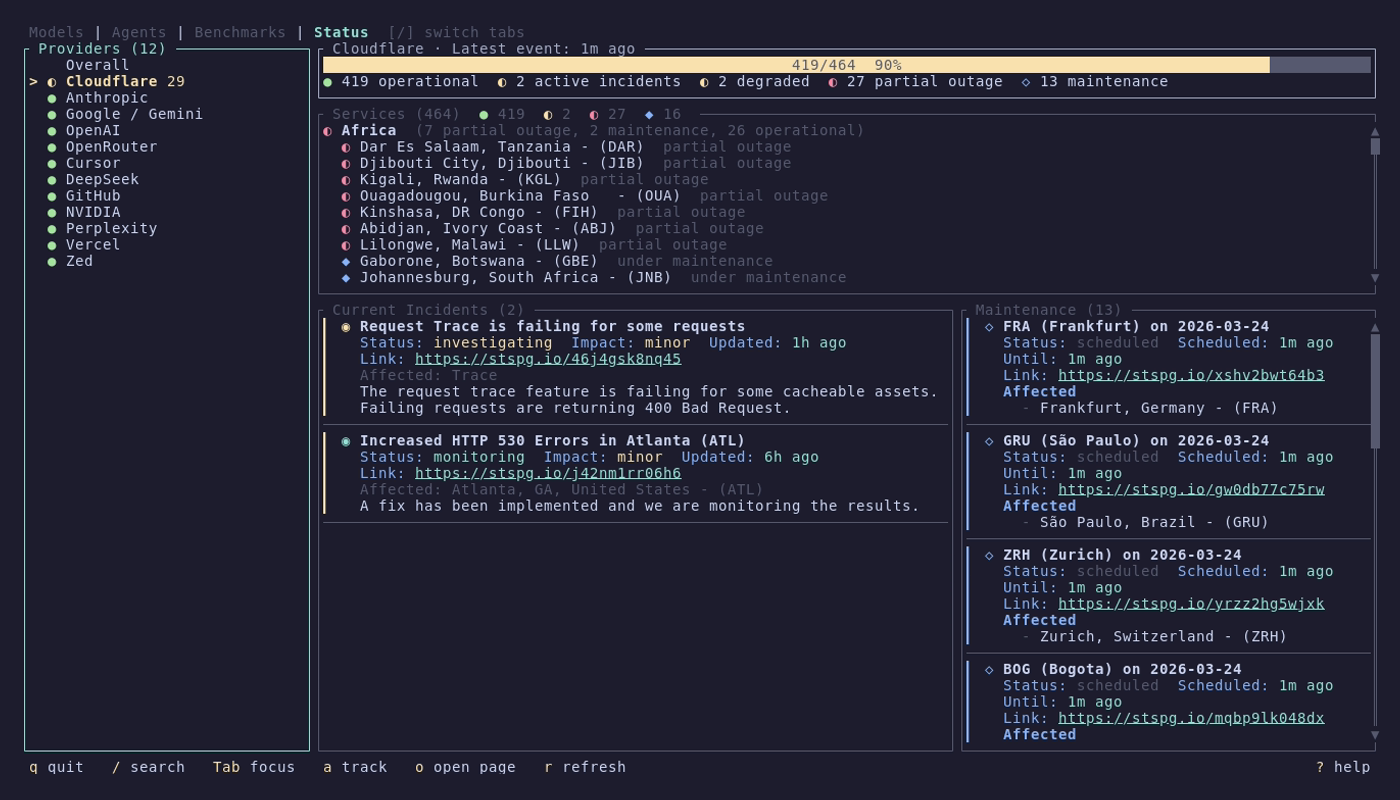
The Status tab uses a two-column layout:
| Column | Width | Content |
|---|---|---|
| Left | Fixed (32 chars) | Provider list with health indicators |
| Right | Flexible | Overall dashboard or provider detail |
| Icon | State | Color |
|---|---|---|
● |
Operational | Green |
◐ |
Degraded | Yellow |
✗ |
Outage | Red |
◆ |
Maintenance (active) | Blue |
◇ |
Maintenance (scheduled) | Blue |
? |
Unknown | Dark gray |
When no specific provider is selected (or when viewing the "Overall" entry at the top of the list), the right panel shows:
- Health gauge -- aggregate health score across all tracked providers
- Icon + count legend -- breakdown of operational, degraded, outage, and maintenance counts
- Incident cards -- active incidents across all providers
- Maintenance cards -- upcoming and in-progress maintenance windows
Select a provider from the list to see its detail view:
- Health gauge -- provider-specific health assessment
- Services panel -- components grouped by service group, each with individual health status
- Incidents panel -- active and recent incidents with timestamps and status updates
- Maintenance panel -- scheduled and in-progress maintenance windows
Use Left/Right to cycle focus between the three detail sub-panels (Services, Incidents, Maintenance).
| Key | Action |
|---|---|
Tab / Left / Right
|
Switch focus (List and Detail) |
Left / Right
|
Cycle detail sub-panels (Services / Incidents / Maintenance) |
/ |
Search providers |
Down / Up
|
Scroll within focused panel |
| Key | Action |
|---|---|
o |
Open provider's status page in browser |
r |
Refresh provider status data |
a |
Add/remove tracked providers |
Press a to open the provider tracking picker. Toggle providers with Space, save with Enter, cancel with Esc. By default, all providers are tracked. Preferences are saved to ~/.config/models/config.toml.
The following 22 providers are tracked by default:
| Provider | Status source |
|---|---|
| OpenAI | Statuspage |
| Anthropic | Statuspage |
| OpenRouter | Statuspage |
| Google / Gemini | Google (custom) |
| Moonshot | Instatus |
| GitHub | incident.io |
| Cursor | BetterStack |
| Perplexity | Statuspage |
| DeepSeek | BetterStack |
| GitLab | Statuspage |
| Poe | Statuspage |
| NanoGPT | BetterStack |
| NVIDIA | Statuspage |
| Vercel | incident.io |
| Helicone | BetterStack |
| Groq | Statuspage |
| Cohere | Statuspage |
| Cerebras | Statuspage |
| Cloudflare | Statuspage |
| Together AI | Statuspage |
| Hugging Face | Statuspage |
| Zed | Instatus |
Status data is fetched from each provider's official status page. If the official source is unavailable, apistatuscheck.com is used as a fallback.
models supports seven status page platforms:
| Platform | Providers using it |
|---|---|
| Statuspage (Atlassian) | OpenAI, Anthropic, OpenRouter, Perplexity, GitLab, Poe, NVIDIA, Groq, Cohere, Cerebras, Cloudflare, Together AI, Hugging Face |
| BetterStack | Cursor, DeepSeek, NanoGPT, Helicone |
| Instatus | Moonshot, Zed |
| incident.io | GitHub, Vercel |
| Google (custom) | Google / Gemini |
| apistatuscheck.com | Fallback for all providers |

The status CLI can be invoked as models status <command> or as a standalone mstatus <command> via a symlink (see Installation#setting-up-command-aliases).
models status statusPrints a summary table of all tracked providers with health icons, component counts, and active issue counts. Always outputs a table (no interactive picker).
models status list
models status list --health degraded   # Filter by health state
models status list --json              # All statuses as JSON
Opens an inline terminal picker with provider list and detail preview. The preview pane prioritizes active incidents over components when issues are present.
Health filter values: operational, degraded, outage, maintenance, unknown.
models status show openai
models status show anthropic --json
Prints a detailed status view for a specific provider, including health assessment, components with individual statuses, active incidents, and scheduled maintenance.
models status sourcesOpens an interactive picker to toggle which providers are tracked. Preferences are saved to ~/.config/models/config.toml.
All status commands support --json for scripting:
models status list --json
models status show openai --json
models status status --json
JSON output includes *_state metadata fields (detail availability, provenance, timing) alongside the provider health data.